
Anke Zhao, Ning Jiang, Jiafa Peng, Shiqin Liu, Yiqun Zhang, Kun Qiu. Parallel generation of low-correlation wideband complex chaotic signals using CW laser and external-cavity laser with self-phase-modulated injection[J]. Opto-Electronic Advances, 2022, 5(5): 200026
- Opto-Electronic Advances
- Vol. 5, Issue 5, 200026 (2022)
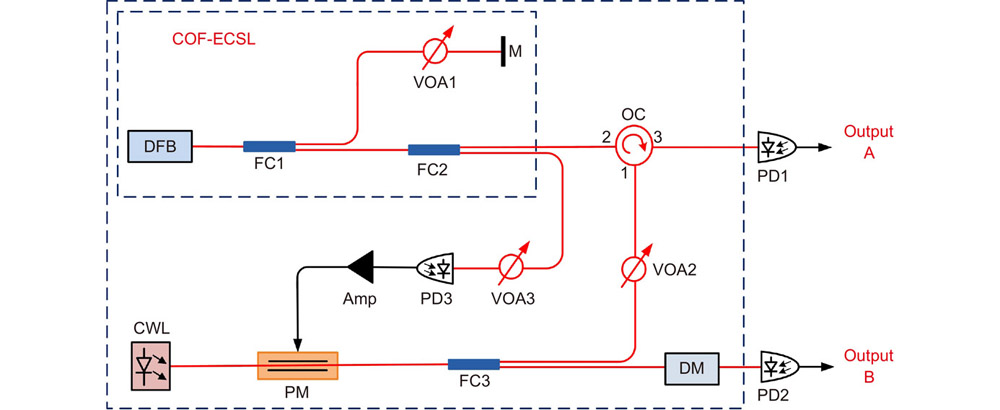
Fig. 1. Experimental schematic diagram of the parallel wideband complex chaos generation. DFB, distributed-feedback laser; PM, electro-optic phase modulator; FC, fiber coupler; CWL, continuous-wave laser; PD, photodetector; M, mirror; VOA, variable optical attenuator; OC, optical circulator; Amp, radio-frequency amplifier; DM, dispersion module.
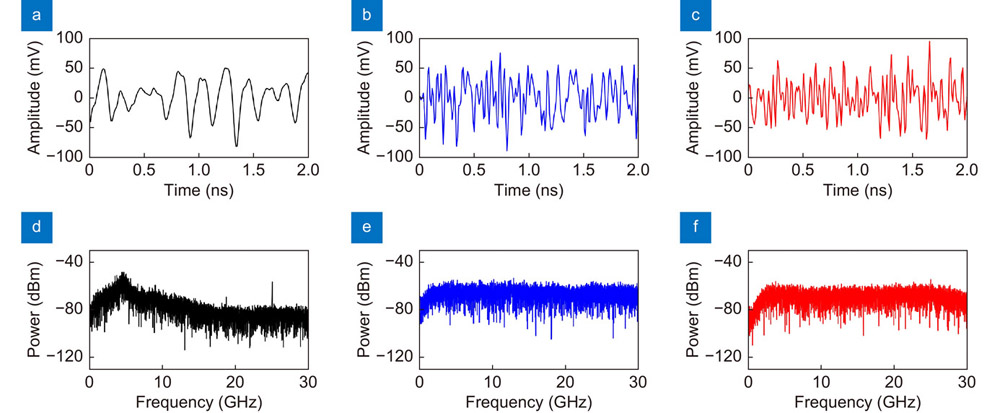
Fig. 2. (a –c ) Experimental time series and (d –f ) power spectra of the chaotic signal obtained by the COF-ECSL (first column); those of the chaotic signals obtained from the output-A (second column), and the output-B of the proposed scheme (third column). The feedback strength is fixed to –30 dB.
Fig. 3. Effective bandwidths of the chaotic signals outputted by COF-ECSL (square), output-A (circle) and output-B (downward-triangle), as a function of feedback strength.
Fig. 4. (a –c ) ACF traces and (d -f ) DMI traces of the chaos generated by COF-ECSL (first column), output-A (second column) and output-B (third column). The feedback strength is fixed to –30 dB.
Fig. 5. |TDS values in (a ) ACF traces and (b ) DMI traces of the chaos generated by COF-ECSL (square), output-A (circle) and output-B (downward-triangle), as a function of feedback strength.
Fig. 6. PE values of the chaos obtained by the COF-ECSL (square), the output-A (circle) and the output-B (downward-triangle), as a function of the feedback strength.
Fig. 7. Correlation coefficient between chaotic signals obtained from output-A and output-B, as a function of feedback strength. The insets are the temporal waveforms of the two chaotic outputs (with a range of 1 ns) measured at the feedback strengths of –30 dB, –20 dB and –10 dB, respectively.
Fig. 8. Experimental time series (left column) and amplitude probability distributions (right column) of (a ) the chaos generated by the COF-ECSL, as well as (b ) the chaotic output-A and (c ) the chaotic output-B of the proposed scheme.

Set citation alerts for the article
Please enter your email address
© Copyright 2018-2021 | Chinese Laser Press. All Rights Reserved 沪ICP备15018463号-20