• Acta Optica Sinica
  • Vol. 39, Issue 5, 0533002 (2019)
Zaiqing Chen1、2, Kai Chen1、2, Xiaoqiao Huang2, Yonghang Tai2, Junsheng Shi2、*, and Lijun Yun1、2
Author Affiliations
  • 1 School of Information Science and Technology, Yunnan Normal University, Kunming, Yunnan 650500, China
  • 2 Yunnan Key Laboratory of Optoelectronic Information Technology, Kunming, Yunnan 650500, China
  • show less
    DOI: 10.3788/AOS201939.0533002 Cite this Article Set citation alerts
    Zaiqing Chen, Kai Chen, Xiaoqiao Huang, Yonghang Tai, Junsheng Shi, Lijun Yun. Color Characterization of Barrier-Type Autostereoscopic Displays[J]. Acta Optica Sinica, 2019, 39(5): 0533002 Copy Citation Text show less
    Settings for acquisition of XYZ tristimulus values of color-sample (8 cm×8 cm square of color sample located at center of display screen and PR-715 spectral radiometer located at 1.4 m away from screen)
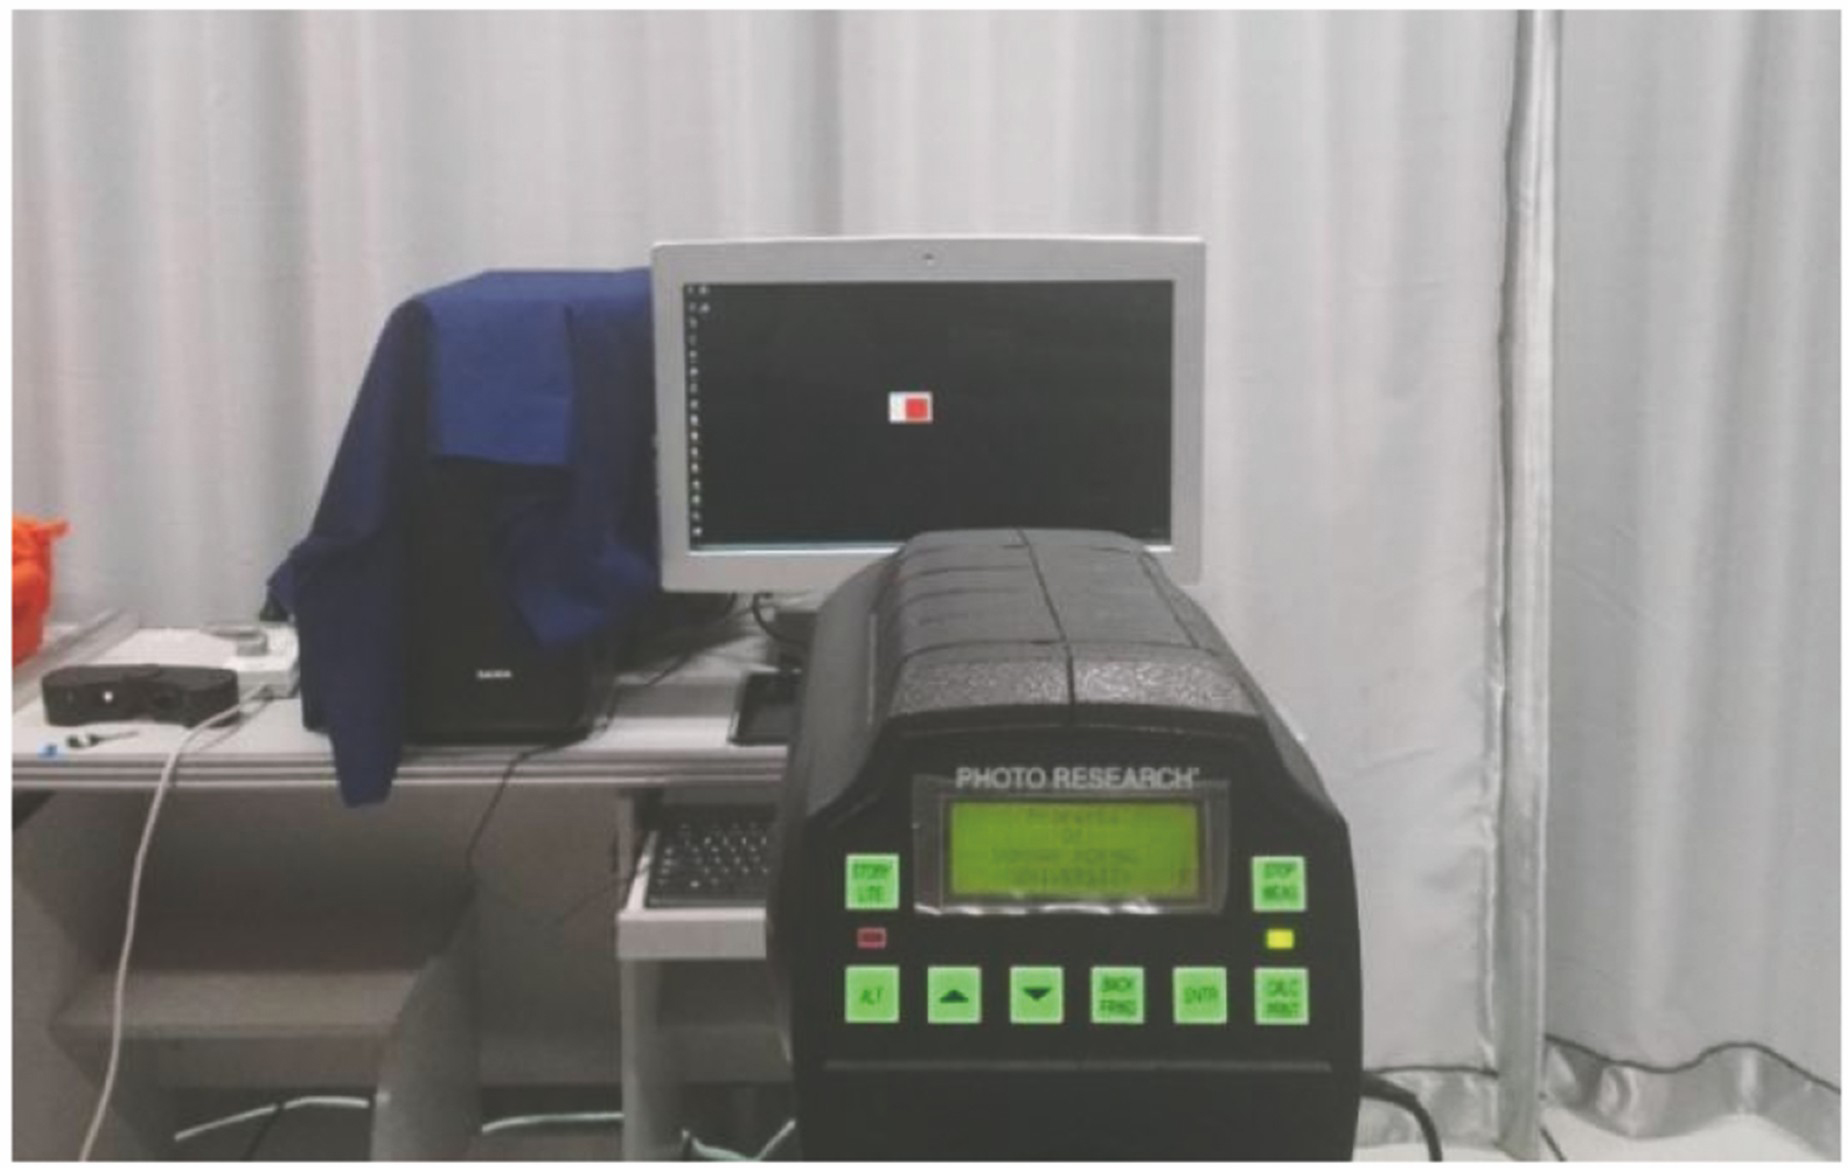
    Fig. 1. Settings for acquisition of XYZ tristimulus values of color-sample (8 cm×8 cm square of color sample located at center of display screen and PR-715 spectral radiometer located at 1.4 m away from screen)
    Test results of channel independence at different brightness levels
    Fig. 2. Test results of channel independence at different brightness levels
    Chromaticity coordinate distribution of primary colors and neutral colors at different brightness levels (triangle vertices indicating chromaticity coordinates of each channel at maximum brightness). (a) 3D mode; (b) 2D mode
    Fig. 3. Chromaticity coordinate distribution of primary colors and neutral colors at different brightness levels (triangle vertices indicating chromaticity coordinates of each channel at maximum brightness). (a) 3D mode; (b) 2D mode
    Fitting curves of GOG model (abscissa indicating normalized values of three color components with maximum color value of 2N-1=255 and ordinate indicating normalized values of XYZ tristimulus). (a) 3D mode; (b) 2D mode
    Fig. 4. Fitting curves of GOG model (abscissa indicating normalized values of three color components with maximum color value of 2N-1=255 and ordinate indicating normalized values of XYZ tristimulus). (a) 3D mode; (b) 2D mode
    Pixel value3D mode2D mode
    XYZXYZ
    dr=25534.95019.1803.81893.18049.3604.836
    dg=25536.78075.60011.110101.600209.60023.690
    db=25522.5008.791113.30049.11019.160255.700
    Table 1. Measurement results of characteristic matrix
    Pixel value(dr=dg=db)3D mode2D mode
    XYZXYZ
    01.4651.6372.4291.2911.4471.844
    162.1872.4193.4512.9143.2933.752
    323.6093.9865.2886.1977.0607.437
    485.6876.2878.15611.25012.85013.140
    648.4319.32512.05017.56020.07020.560
    8011.86013.12016.99025.67029.37030.160
    9615.95017.62022.59035.45040.57041.560
    11220.68022.87029.28047.24054.12055.090
    12826.66629.34337.54460.95069.67071.700
    14432.82036.23046.29076.53087.52089.790
    16039.83044.03056.19094.480108.200110.200
    17647.99052.97067.760114.700131.200134.000
    19256.50062.35079.910137.100156.600160.400
    20865.68072.55092.910161.300184.200189.100
    22476.16084.090107.900187.500214.100219.900
    24086.78095.920122.600215.400245.800252.400
    25597.120107.400137.300242.200276.600283.900
    Table 2. XYZ tristimulus values of 17 neutral color sample points
    Channel3D mode2D mode
    kGkOγR2kGkOγR2
    Red1.00710.00001.92360.99990.998880.000002.018870.9999
    Green1.04080.00001.94790.99991.003270.000002.010610.9999
    Blue1.06010.00001.95490.99991.006960.000002.027290.9999
    Table 3. Fitting results of GOG model parameters
    Zaiqing Chen, Kai Chen, Xiaoqiao Huang, Yonghang Tai, Junsheng Shi, Lijun Yun. Color Characterization of Barrier-Type Autostereoscopic Displays[J]. Acta Optica Sinica, 2019, 39(5): 0533002
    Download Citation