
Yeyuan Huang, Ang Li, Min Qin, Zhaokun Hu, Pinhua Xie, Jin Xu, Jun Duan, Hongmei Ren, Xin Tian, Xiaomei Li, Bo Ren, Qiang Zhang, Hongyan Zhong. Nitrogen Oxides Spatial Distribution and Emissions with Mobile Multi-Axis Differential Optical Absorption Spectroscopy in Wuhan City[J]. Acta Optica Sinica, 2021, 41(10): 1030002
- Acta Optica Sinica
- Vol. 41, Issue 10, 1030002 (2021)
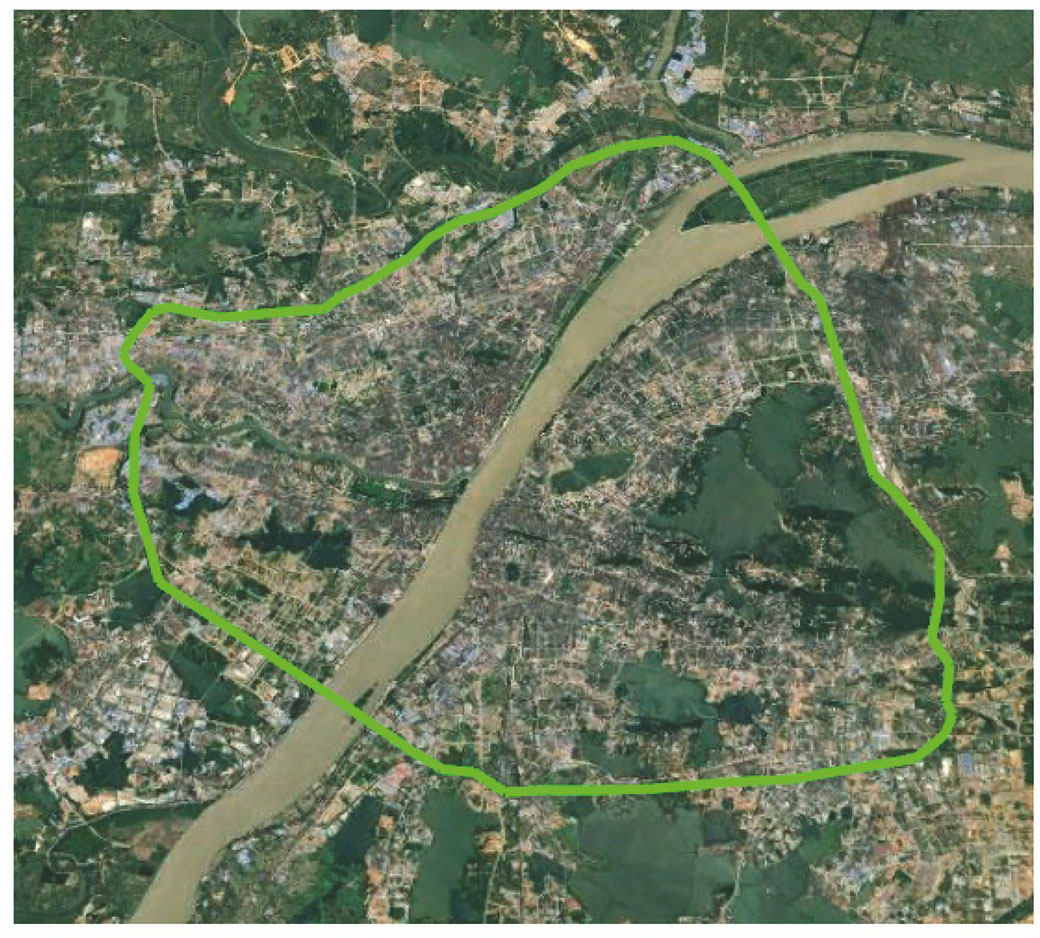
Fig. 1. Measurement route of mobile MAX-DOAS (the thirdring road of Wuhan, map data copyright© Google Earth)

Fig. 2. Mobile MAX-DOAS system
Fig. 3. Fitting example for NO2 DSCD and the fitting error (RMSE). (a) Fitting example; (b) fitting error
Fig. 4. Schematic of portable ultraviolet DOAS system
Fig. 5. NO2 VCD spatial distribution measured by mobile MAX-DOAS and the average wind speed (u) and wind direction (the arrows indicate the average wind direction)
Fig. 6. Monthly mean NO2 mass concentration of Wuhan from September, 2019 to March, 2020
Fig. 7. NO2 VCD measured by Mobile MAX-DOAS and NO2 VCD in troposphere measured by Tropomi on Feb. 29th. (a) Comparison of NO2 VCDs; (b) correlation coefficient of NO2 VCDs
Fig. 8. Spatial distribution of R(NOx) obtained by portable ultraviolet DOAS
Fig. 9. NOx emission flux of the third ring road of Wuhan and its error
Fig. 10. Proportion (R2) of NOx emission flux error of the third ring road of Wuhan caused by different error sources (using real-time [NOx]/[NO2] and its errors for NOx emission flux and flux errors calculation)
Fig. 11. Proportion (R2) of NOx emission flux error of the third ring road of Wuhan caused by different error sources (using average [NOx]/[NO2] and its errors for NOx emission flux and flux errors calculation)
|
Table 1. Parameters for NO2 retrieval with QDOAS

Set citation alerts for the article
Please enter your email address
© Copyright 2018-2021 | Chinese Laser Press. All Rights Reserved 沪ICP备15018463号-20