
Yuxin Tang, Ping Sun, Qing Dai, Chao Fan, Zhifang Lei. New Method for Surface Shape Measurement Based on Brox Optical Flow Algorithm[J]. Acta Optica Sinica, 2020, 40(17): 1712004
- Acta Optica Sinica
- Vol. 40, Issue 17, 1712004 (2020)
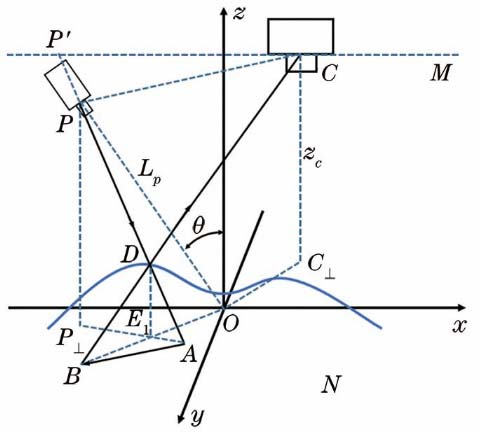
Fig. 1. Optical path of surface shape measurement using optical flow method
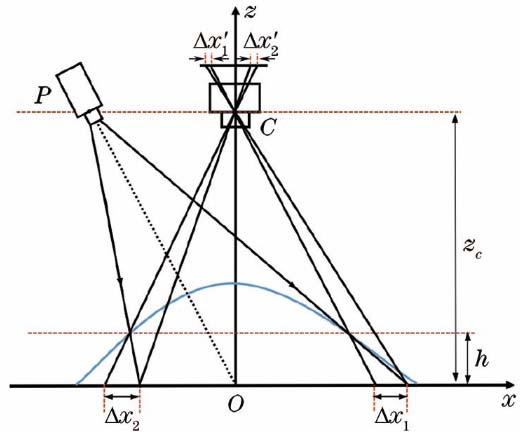
Fig. 2. Optical path setup when height of center of camera is at same height as that of projector
Fig. 3. Diagram of error correction when center of camera is not at same height as that of projector
Fig. 4. Actual height distribution of measured spherical crown
Fig. 5. Simulated fringe patterns. (a) Fringe before deformation; (b) fringe after deformation
Fig. 6. Simulated results of surface shape. (a) Calculated height distribution of spherical crown; (b) comparison between calculated value and true value at cross section of y=256 pixel when incident angle is π/100; (c) absolute errors between calculated values and theoretical values at cross section of y=256 pixel under different incident angles; (d) absolute errors of calculated values when Gaussian noises with 10 dB and 20 dB are added, respectively
Fig. 7. Influence of calibration error on calculated results. (a) Comparison of absolute errors of surface height before and after zc increased by 5 mm; (b) comparison of absolute errors of surface height before and after Lp increased by 5 mm
Fig. 8. Calculated results of spherical crown after correction. Calculated results (a) before and (b) after correction when center of projector is not at same height as that of camera; comparison between calculated value and true value at cross section of y=256 pixel (c) before and (d) after correction; (e) absolute errors of results after correction
Fig. 9. Fringe patterns in experiment. (a) Before modulation; (b) after modulation
Fig. 10. Measured results of mask before correction. 2D height distributions obtained by (a) Fourier transform method and (b) optical flow method; (c) comparison of data obtained by phase shift method and optical flow method at cross section of y=300 pixel
Fig. 11. 2D height distribution of mask obtained by optical flow method after correction
Fig. 12. Comparison of measured results at cross section of y=300 pixel before and after correction

Set citation alerts for the article
Please enter your email address
© Copyright 2018-2021 | Chinese Laser Press. All Rights Reserved 沪ICP备15018463号-20