Jing LUO1,2,3, Siyun CHEN1,2,3, Xuan SUN4,*, Yuanyuan ZHU1,2,3..., Juxin ZENG1,2,3 and Guangping CHEN5|Show fewer author(s)
Author Affiliations
1College of Public Administration, Central China Normal University, Wuhan 430079, China2School of Management, Wuhan Institute of Technology, Wuhan 430205, China3Department of Urban Planning and Design, University of Hong Kong, Hong Kong 999077, China4Institute of Geographic Sciences and Natural Resources Research, CAS, Beijing 100101, China5School of Earth Sciences, Zhejiang University, Hangzhou 310027, Chinashow less
DOI: 10.1007/s11442-020-1740-9
Cite this Article
Jing LUO, Siyun CHEN, Xuan SUN, Yuanyuan ZHU, Juxin ZENG, Guangping CHEN. Analysis of city centrality based on entropy weight TOPSIS and population mobility: A case study of cities in the Yangtze River Economic Belt[J]. Journal of Geographical Sciences, 2020, 30(4): 515
Copy Citation Text
show less
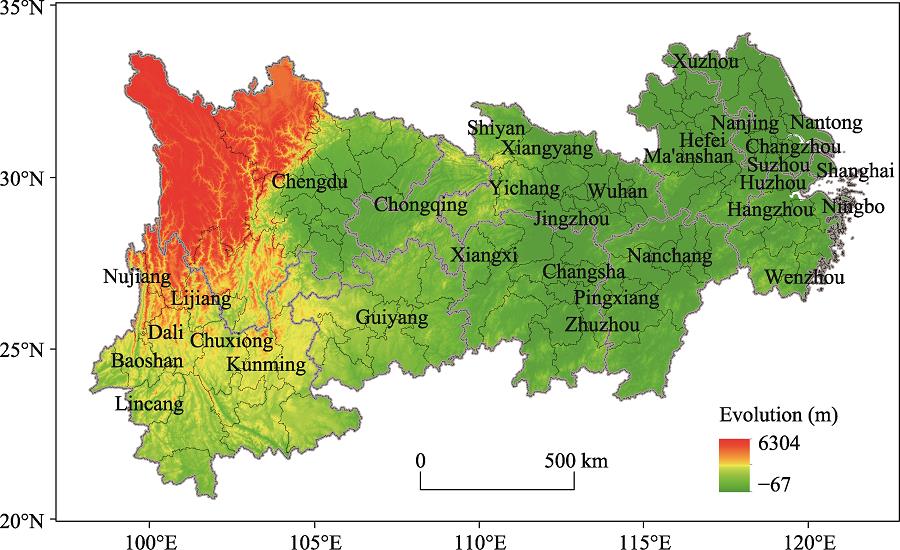
Fig. 1. Location and administrative divisions of the Yangtze River Economic Belt
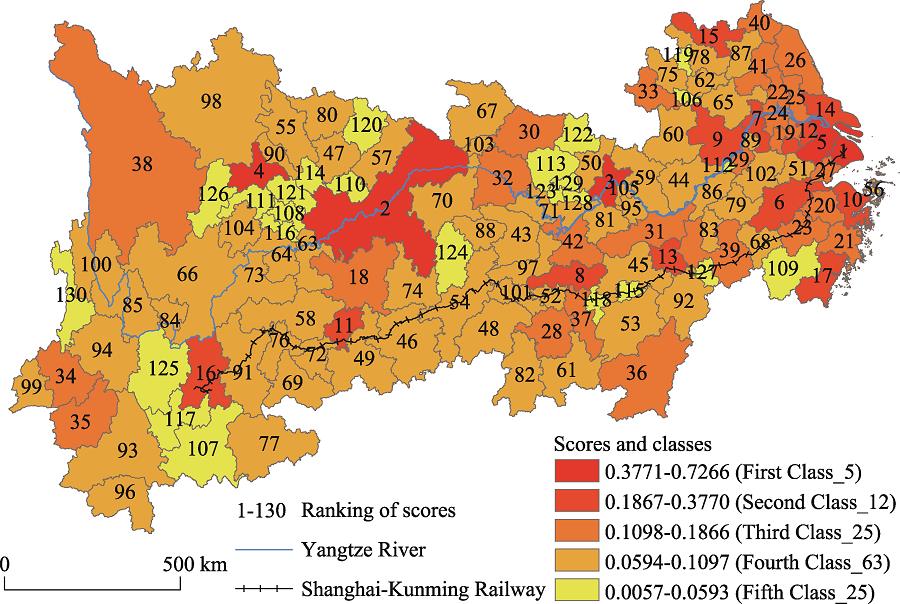
Fig. 2. Scores and classes of city centrality in the Yangtze River Economic Belt
Fig. 3. Clustering of city centrality of the Yangtze River Economic Belt
Fig. 4. Hotspot analysis of city centrality of the Yangtze River Economic Belt
Fig. 5. The top 5 factors influencing city centrality in the Yangtze River Economic Belt
Fig. 6. Ranking of cumulative contributions of the top 5 indicators in the ranking of cities of different classes in the Yangtze River Economic Belt
Fig. 7. Population inflows between cities in the Yangtze River Economic Belt (The above data are for 2016)
Fig. 8. Population outflows between cities in the Yangtze River Economic Belt (the above data are for 2016)
Fig. 9. The population flows into the Yangtze River Economic Belt from other parts of China (the above data are for 2016)
Fig. 10. Population outflow from the Yangtze River Economic Belt to other parts of China (the above data are for 2016)
| Indicator | Symbol | Indicator | Symbol |
|---|
| Total permanent residential population | C1 | Number of authorized patents | C10 | | GDP | C2 | High-tech output value | C11 | | Added value of secondary and tertiary industries | C3 | Number of high-speed railway and express railway stations | C12 | | Total fixed assets investment | C4 | Number of civil airports | C13 | | Total retail sales of consumer goods | C5 | Total amount of cargo transported | C14 | | Actual use of foreign investment | C6 | Total number of passengers transported | C15 | | Amount of imports and exports | C7 | Number of colleges and universities | C16 | | Tourism income | C8 | Number of students in colleges and universities | C17 | | R&D expenditure | C9 | | |
|
Table 1. Symbol of each indicator
| Indicators | Data sources |
|---|
| C1, C2, C3, C4, C5, C6, C14, C15, C16, C17 | China Urban Statistical Yearbook (2017) | | C1, C2, C3, C4, C5, C6, C7, C8, C9, C10, C11, C14, C15, C16, C17 | Statistical Yearbooks (2017) of the cities in the YREB | | C1, C2, C3, C4, C5, C6, C7, C8, C9, C10, C11, C14, C15, C16, C17 | 2016 National Economic and Social Development Statistics Bulletin of the cities in the YREB | | C12 | 12306 China Railway (https://www.12306.cn/mormhweb/czyd_2143/) | | C13 | 2016 Civil Aviation Airport Production Statistics Bulletin of China (http://www.caac.gov.cn/XXGK/XXGK/TJSJ/201702/t20170224_42760.html) |
|
Table 2. Data sources for indicators
| Indicator | Weight | Indicator | Weight |
|---|
| C1 | 0.0691 | C10 | 0.0572 | | C2 | 0.1039 | C11 | 0.0708 | | C3 | 0.0781 | C12 | 0.0480 | | C4 | 0.0581 | C13 | 0.0403 | | C5 | 0.0659 | C14 | 0.0408 | | C6 | 0.0654 | C15 | 0.0423 | | C7 | 0.0514 | C16 | 0.0527 | | C8 | 0.0363 | C17 | 0.0616 | | C9 | 0.0581 | — | — |
|
Table 3. Weight of each indicator
| Classification | Correlation coefficient | P |
|---|
| The correlation coefficient between population inflows and the centrality scores of cities in the YREB | 0.9030 | 8.56E-49 | | The correlation coefficient between populationoutflows and the centrality scores of cities in the YREB | 0.9257 | 6.66E-56 | | The correlation coefficient between population entering the YREB from other cities in China and the centrality scores of cities in the YREB | 0.9508 | 5.48E-67 | | The correlation coefficient between population flowing out of the YREB to other cities in China and the centrality scores of cities in the YREB | 0.8613 | 1.84E-39 |
|
Table 4. The correlation coefficient between population flows and the centrality scores of cities in the Yangtze River Economic Belt
| The source city for population inflow from first-class cities | The source city for population inflow from second-class cities | The source city for population inflow from third-class cities | The source city for population inflow from fourth-class cities | The source city for population inflow for fifth-class cities |
|---|
| Class | Proportion (%) | Class | Proportion (%) | Class | Proportion (%) | Class | Proportion (%) | Class | Proportion (%) | | First | 55.01 | First | 35.85 | Second | 43.09 | Second | 33.81 | First | 43.15 | | Second | 23.65 | Third | 23.43 | First | 28.25 | First | 31.06 | Fourth | 22.34 | | Fourth | 13.78 | Second | 19.91 | Third | 14.86 | Fourth | 18.83 | Second | 19.76 | | Fifth | 4.96 | Fourth | 17.71 | Fourth | 12.20 | Third | 11.58 | Fifth | 8.38 | | Third | 2.59 | Fifth | 3.10 | Fifth | 1.60 | Fifth | 4.73 | Third | 6.38 |
|
Table 5. The source city for population inflow from different classes of city in the Yangtze River Economic Belt
| The destination city for the population outflow from first-class cities | The destination city for the population outflow from second-class cities | The destination city for the population outflow from third-class cities | The destination city for the population outflow from fourth-class cities | The destination city for the population outflow from fifth-class cities |
|---|
| Class | Proportion (%) | Class | Proportion (%) | Class | Proportion (%) | Class | Proportion (%) | Class | Proportion (%) | | First | 42.39 | First | 42.39 | Second | 38.11 | Second | 28.49 | First | 36.00 | | Second | 22.47 | Second | 22.47 | First | 23.55 | First | 26.60 | Fourth | 28.46 | | Fourth | 21.68 | Fourth | 21.68 | Fourth | 18.50 | Fourth | 25.50 | Second | 17.40 | | Fifth | 7.91 | Fifth | 7.91 | Third | 17.85 | Third | 13.27 | Fifth | 10.48 | | Third | 5.55 | Third | 5.55 | Fifth | 2.00 | Fifth | 6.15 | Third | 7.66 |
|
Table 6. The destination city for the population outflow from different classes of city in the Yangtze River Economic Belt
| Source area of the population inflow for first-class cities | Source area for the population inflow for second-class cities | Source area for the population inflow for third-class cities | Source area for the population inflow for fourth-class cities | Source area for the population inflow for fifth-class cities |
|---|
| Area Proportion (%) | Area Proportion (%) | Area Proportion (%) | Area Proportion (%) | Area Proportion (%) | | Guangdong | 45.32 | Beijing | 44.73 | Guangdong | 61.27 | Guangdong | 59.70 | Guangdong | 55.08% | | Beijing | 34.38 | Guangdong | 39.68 | Beijing | 29.68 | Beijing | 25.77 | Beijing | 33.12 | | Jilin | 4.50 | Guangxi | 4.51 | Henan | 3.11 | Fujian | 5.43 | Fujian | 3.45 | | Hainan | 4.45 | Jilin | 3.62 | Fujian | 1.77 | Guangxi | 2.63 | Henan | 2.49 | | Shaanxi | 3.45 | Shandong | 2.00 | Shandong | 1.25 | Henan | 2.06 | Tibet | 1.46 | | Tianjin | 3.06 | Henan | 1.36 | Shaanxi | 0.68 | Shaanxi | 0.98 | Hainan | 1.43 | | Liaoning | 1.54 | Tianjin | 1.21 | Heilongjiang | 0.38 | Hainan | 0.93 | Guangxi | 0.77 | | Hong Kong | 1.54 | Shaanxi | 1.12 | Guangxi | 0.38 | Tianjin | 0.91 | Shandong | 0.75 | | Fujian | 0.79 | Hainan | 0.87 | Liaoning | 0.38 | Hebei | 0.42 | Shaanxi | 0.59 | | Tibet | 0.72 | Hebei | 0.32 | Tianjin | 0.34 | Liaoning | 0.41 | Tianjin | 0.23 | | Shandong | 0.14 | Heilongjiang | 0.26 | Jilin | 0.19 | Tibet | 0.23 | Hebei | 0.22 | | Inner Mongolia | 0.11 | Inner Mongolia | 0.14 | Hainan | 0.14 | Shandong | 0.19 | Liaoning | 0.14 | | — | — | Gansu | 0.11 | Gansu | 0.14 | Jilin | 0.13 | Jilin | 0.12 | | — | — | Liaoning | 0.07 | Tibet | 0.14 | Gansu | 0.10 | Gansu | 0.08 | | — | — | — | — | Ningxia | 0.10 | Shanxi | 0.03 | Xinjiang | 0.04 | | — | — | — | — | Hebei | 0.04 | Heilongjiang | 0.03 | Shanxi | 0.04 | | — | — | — | — | Shanxi | 0.01 | Inner Mongolia | 0.03 | — | — | | — | — | — | — | Qinghai | 0.01 | Macao | 0.03 | — | — |
|
Table 7. Source areas (outside the YREB) for population inflow for different classes of city in the Yangtze River Economic Belt
| Destination area for the first-class city outflow population | Destination area for the second-class city outflow population | Destination area for the third-class city outflow population | Destination area for the fourth-class city outflow population | Destination area for the fifth-class city outflow population |
|---|
| Area proportion (%) | Area proportion (%) | Area proportion (%) | Area proportion (%) | Area proportion (%) | | Guangdong | 37.59 | Beijing | 49.46 | Guangdong | 43.24 | Guangdong | 47.26 | Guangdong | 46.21 | | Beijing | 37.18 | Guangdong | 32.44 | Beijing | 40.21 | Beijing | 31.46 | Beijing | 38.21 | | Hainan | 5.16 | Guangxi | 3.59 | Henan | 7.17 | Fujian | 5.57 | Fujian | 4.13 | | Jilin | 3.94 | Henan | 3.52 | Shandong | 2.09 | Henan | 4.89 | Henan | 4.09 | | Tianjin | 3.91 | Shandong | 3.28 | Shaanxi | 1.22 | Guangxi | 3.51 | Shandong | 1.65 | | Shaanxi | 3.33 | Jilin | 3.12 | Fujian | 1.20 | Shaanxi | 2.17 | Tibet | 1.61 | | Hong Kong | 2.33 | Shaanxi | 1.07 | Jilin | 0.96 | Tianjin | 1.39 | Hainan | 1.13 | | Shandong | 2.30 | Tianjin | 0.89 | Heilongjiang | 0.82 | Hainan | 1.04 | Shaanxi | 1.10 | | Liaoning | 1.79 | Fujian | 0.79 | Guangxi | 0.81 | Shandong | 0.71 | Guangxi | 0.99 | | Tibet | 1.48 | Hebei | 0.49 | Liaoning | 0.63 | Liaoning | 0.67 | Tianjin | 0.49 | | Fujian | 0.85 | Hainan | 0.48 | Tianjin | 0.60 | Hebei | 0.54 | Shanxi | 0.18 | | Inner Mongolia | 0.14 | Heilongjiang | 0.45 | Tibet | 0.31 | Tibet | 0.34 | Hebei | 0.10 | | — | — | Inner Mongolia | 0.24 | Gansu | 0.24 | Gansu | 0.22 | Gansu | 0.07 | | — | — | Liaoning | 0.17 | Hebei | 0.21 | Jilin | 0.11 | Liaoning | 0.04 | | — | — | — | — | Hainan | 0.19 | Inner Mongolia | 0.05 | Ningxia | 0.01 | | — | — | — | — | Hong Kong | 0.10 | Heilongjiang | 0.05 | — | — | | — | — | — | — | Shanxi | 0.01 | Macao | 0.03 | — | — | | — | — | — | — | — | — | Shanxi | 0.02 | — | — |
|
Table 8. Destination areas (outside the YREB) for population outflow for different classes of city in the Yangtze River Economic Belt