
Jing LUO, Siyun CHEN, Xuan SUN, Yuanyuan ZHU, Juxin ZENG, Guangping CHEN. Analysis of city centrality based on entropy weight TOPSIS and population mobility: A case study of cities in the Yangtze River Economic Belt[J]. Journal of Geographical Sciences, 2020, 30(4): 515
- Journal of Geographical Sciences
- Vol. 30, Issue 4, 515 (2020)
Abstract
Keywords
1 Introduction
Studies on the measurement of city centrality have been previously conducted and a single indicator has mainly been used.
The central place theory in geography was introduced to China in the 1960s and has been widely applied and empirically researched. Research on the index system and methods for measurement of centrality has undergone developments and refinements.
The preliminary concept of the YREB was proposed in the 1980s, and has been widely accepted by the academic communities since 1994. Since 2014, the YREB has become part of the national strategic plan and a research hotspot (
2 Study area
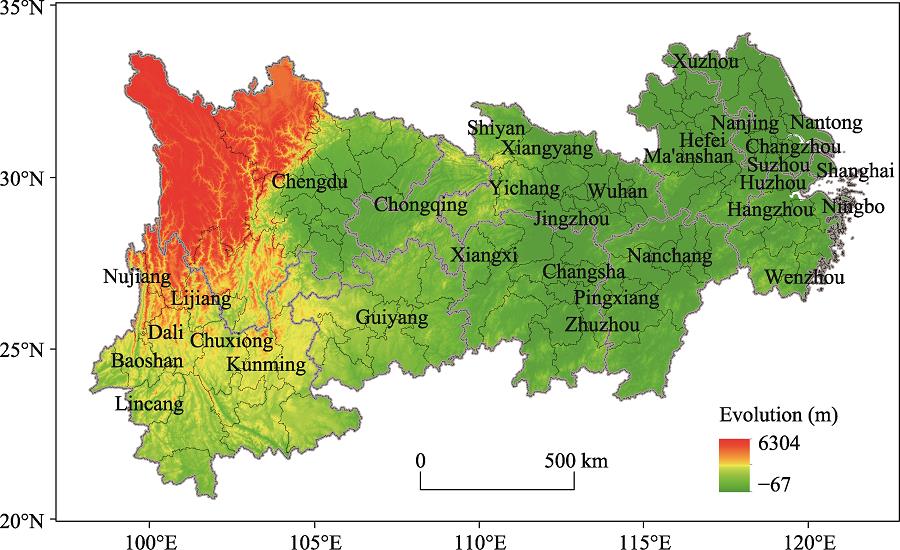
The Yangtze River Economic Belt (YREB) covers 9 provinces and 2 municipalities administered directly under the central government, and includes Jiangsu, Zhejiang, Anhui, Jiangxi, Hubei, Hunan, Sichuan, Yunnan, Guizhou, Shanghai, and Chongqing. The belt consists of 130 cities (including the 2 municipalities, 5 sub-provincial cities, 103 prefecture-level administered cities, 16 autonomous prefectures, 3 county-level cities directly under the jurisdiction of the province and 1 forested district) (
![]()
Figure 1.
3 Data and methods
3.1 Data
3.1.1 Socio-economic statistical data
Seventeen indicators (
| Indicator | Symbol | Indicator | Symbol |
|---|---|---|---|
| Total permanent residential population | C1 | Number of authorized patents | C10 |
| GDP | C2 | High-tech output value | C11 |
| Added value of secondary and tertiary industries | C3 | Number of high-speed railway and express railway stations | C12 |
| Total fixed assets investment | C4 | Number of civil airports | C13 |
| Total retail sales of consumer goods | C5 | Total amount of cargo transported | C14 |
| Actual use of foreign investment | C6 | Total number of passengers transported | C15 |
| Amount of imports and exports | C7 | Number of colleges and universities | C16 |
| Tourism income | C8 | Number of students in colleges and universities | C17 |
| R&D expenditure | C9 |
Table 1.
Symbol of each indicator
Socio-economic statistical data were taken from the China Urban Statistical Yearbook (2017), the Statistical Yearbooks (2017) of the cities in the YREB, the 2016 National Economic and Social Development Statistics Bulletin of the cities in the YREB, the 12306 China Railway, and the 2016 Civil Aviation Airport Production Statistics Bulletin of China (
| Indicators | Data sources |
|---|---|
| C1, C2, C3, C4, C5, C6, C14, C15, C16, C17 | China Urban Statistical Yearbook (2017) |
| C1, C2, C3, C4, C5, C6, C7, C8, C9, C10, C11, C14, C15, C16, C17 | Statistical Yearbooks (2017) of the cities in the YREB |
| C1, C2, C3, C4, C5, C6, C7, C8, C9, C10, C11, C14, C15, C16, C17 | 2016 National Economic and Social Development Statistics Bulletin of the cities in the YREB |
| C12 | 12306 China Railway ( |
| C13 | 2016 Civil Aviation Airport Production Statistics Bulletin of China ( |
Table 2.
Data sources for indicators
3.1.2 Population flow data
When studying the degree of inter-city linkages, data from the inter-urban migration of the YREB were used. The data, which were based on the population migration number according to Tencent in 2016, reflect the relative value of desensitization and not the absolute number of migrants. The top ten cities based on population migration and emigration were selected and data were entered into ArcGIS for analysis.
3.2 Methods
3.2.1 Entropy weight TOPSIS model
City centrality was measured with the entropy weight TOPSIS (Technique for Order of Preference by Similarity to Ideal Solution) model. The TOPSIS model is a sort method (
| Indicator | Weight | Indicator | Weight |
|---|---|---|---|
| C1 | 0.0691 | C10 | 0.0572 |
| C2 | 0.1039 | C11 | 0.0708 |
| C3 | 0.0781 | C12 | 0.0480 |
| C4 | 0.0581 | C13 | 0.0403 |
| C5 | 0.0659 | C14 | 0.0408 |
| C6 | 0.0654 | C15 | 0.0423 |
| C7 | 0.0514 | C16 | 0.0527 |
| C8 | 0.0363 | C17 | 0.0616 |
| C9 | 0.0581 | — | — |
Table 3.
Weight of each indicator
(1) To standardize the original data of various indicators and adopt extreme value standardization:
where Rij is the standardized value of each index, ${{R}_{ij}}\in [0,1]$; xij is the evaluation index of each city; minj is the minimum value of the index; and maxj is the maximum value of the index. Given that the indicators used in this study all have a positive effect on the final evaluation results, the standardized treatment of positive indicators is adopted.
(2) To calculate the value of entropy:
where Ej is the entropy value; k is the constant term, k = 1/lnm; pij is the proportion of the index value of item j of i city.
(3) To calculate the index weight wj:
(4) To establish a standardized decision matrix V:
(5) To determine the positive and negative ideal solutions:
Positive indicators
Positive ideal solution:
Negative ideal solution:
Negative indicators
Positive ideal solution:
Negative ideal solution:
Given that the indicators used in this study all have a positive effect on the final evaluation results, the standardized treatment of positive indicators is adopted.
(6) To calculate the distance between the positive and negative ideal solutions for each city:
where $D_{i}^{+}$ and $D_{i}^{-}$ are the distances of the positive and negative ideal solutions, respectively.
(7) To calculate the score of comprehensive evaluation:
where Yi is the closeness of the evaluated target object and the optimal solution. The larger Yi is, the better the evaluation result.
3.2.2 Obstacle degree model
The obstacle degree model (
where Cj is the degree of influence of j indicators on the centrality of a city; Rij is the standardized value of each index, ${{R}_{ij}}\in [0,1]$; and wj is the weight of each index. The larger Cj is, the greater importance of this indicator for urban centrality.
3.2.3 ArcGIS XY To Line tool
The ArcGIS XY To Line tool was used to analyze inter-city population migration and study inter-city linkages. The XY To Line tool in the Arc Toolbox generates straight lines based on the starting and ending coordinates in the input table. The cities in the YREB are set as the starting and ending points, and population migration between cities is regarded as the attribute of the connection between two points, which is used for analysis.
4 Results
4.1 Analysis of centrality
Using the natural breakpoint method, the score is divided into five classes and the overall ranking of cities from east to west gradually decreases until it runs backward (
![]()
Figure 2.
The first-class cities are Shanghai, Chongqing, Wuhan, Chengdu, and Suzhou. Two regions are in the lower and the upper reaches of the Yangtze River, and one region is in the middle reaches of the river. Two cities (Shanghai and Chongqing) are directly under the central government and two (Wuhan and Chengdu) are sub-provincial cities. Suzhou is an important central city in the Yangtze River Delta urban agglomeration. These cities are important node cities of the YREB and play a role in promoting the overall development of the YREB. Shanghai and Chongqing are national central cities in accord with the National Urban System Planning (2010-2020). Shanghai is the leading city in the whole of the YREB, and Chongqing is the leading city in the upper reaches of the YREB. In 2016, Chengdu was given the support of the National Development and Reform Commission and the Ministry of Housing and Construction to establish a national central city. Together with Chongqing, this city promotes the development of the Chengdu-Chongqing urban agglomeration. Wuhan is the central city in the middle reaches of the Yangtze River. In 2016, Wuhan was positioned as one of the three core cities of the YREB in the Outline of the YREB Development Plan. In 2018, it was given the support of the National Development and Reform Commission and the Ministry of Housing and Urban-Rural Development to establish a national central city. Suzhou is a national high-tech industrial base undergoing rapid economic and social development.
There are 12 second-class cities: Hangzhou, Nanjing, Changsha, Hefei, Guiyang, Nanchang, and Kunming, as well as Ningbo, Changzhou, Nantong, Xuzhou, and Wenzhou. In this category, there are 8 cities in the lower reaches of the Yangtze River, 2 in the middle reaches, and 2 in the upper reaches. Seven of the cities are provincial capitals and five are cities in Jiangsu and Zhejiang provinces. These results show that the provincial capitals are located in the upper and middle reaches of the Yangtze River and the cities in Jiangsu and Zhejiang provinces have strong centrality.
There are 25 cities in the third-class category, mainly in the lower and middle reaches of the Yangtze River, and a few in the upper reaches. The number of cities in the lower, middle and upper reaches of the Yangtze River is 13, 8 and 4, respectively; these represent the most important node cities in the region.
The fourth-class category contains 63 cities, mainly in the middle and upper reaches of the Yangtze River with a few in the lower reaches. There are 14 cities in the lower reaches, 21 in the middle reaches, and 28 in the upper reaches of the Yangtze River. The fifth-class cities number 25, most of which are located in the upper reaches of the Yangtze River with a few in the middle and lower reaches. The number of cities in the lower, middle and upper reaches of the Yangtze River is 4, 9 and 12, respectively. The centrality of the fourth- and fifth-class cities has gradually weakened, and the number of distributions has increased from downstream to upstream, indicating that the cities in the upper reaches of the Yangtze River are weaker than those in the middle and lower reaches.
The results of spatial autocorrelation analysis show that the Yangtze River Delta is a high-high agglomeration area with high significance; parts of southern Sichuan and western Yunnan, as well as Shiyan and Jingzhou, are low-low agglomeration areas; Huzhou and Ma’anshan are low-high agglomeration areas; Wuhan, Xiangyang, Yichang, Chengdu, Kunming, Baoshan, and Lincang are high-low agglomeration areas (
![]()
Figure 3.
![]()
Figure 4.
4.2 Analysis of factors influencing centrality
After analysis of the cumulative contribution of the top 5 indicators in terms of the size of the contribution (Figures 5 and 6), it was found that for the first- and second-class cities, the cumulative contribution of the GDP is the largest indicator, and the impact of GDP is significantly greater than other indicators. This result shows that the economies of the first- and second-class cities are very large, which clearly confers considerable advantages to these cities. The cumulative contribution of the number of students in colleges and universities ranks second, indicating that the first- and second-class cities play an extremely important role in higher education. In the first- and second-class cities, the cumulative contribution of the secondary and tertiary industries equates to high added value, and together with the total retail sales for consumer goods, the high-tech output value, the number of colleges and universities, and the total permanent population is very large. This finding confirms that industry, consumption, scientific research, higher education, and the size of the population are the main competitive features of the first- and second-class cities.
![]()
Figure 5.
![]()
Figure 6.
For the third-class cities, the cumulative contribution of the number of civil airports has rapidly become the largest indicator, followed by the cumulative contribution of GDP, then the total permanent residential population. The high-tech output value and the number of authorized patents also have a significant contribution. The relative importance of the number of high-speed and express railway stations and total cargo transported has increased. The latter shows that in the third-class cities, the impact of transportation has improved significantly.
For the fourth-class cities, the cumulative contribution of the number of civil airports is still the highest indicator, and the advantages here are quite clear. The cumulative contribution of the total permanent population is the second highest, followed by the cumulative contribution of GDP, but the value is less than half of that for the total permanent population. For the fifth-class cities, the first and second largest indicators of cumulative contribution are the total permanent population and GDP, respectively. For both the fourth- and fifth-class cities, the cumulative contribution of the number of high-speed and express railway stations, total cargo transported, the total fixed assets investment, and the total number of passengers transported are clearly highly ranked. However, the cumulative contribution of the total retail sales of consumer goods, the added value for secondary and tertiary industries, the number of students in colleges and universities, the high-tech output value, and the number of authorized patents is low. This result indicates that for the fourth- and fifth-class cities, the impact of traffic on centrality is dominant; also population still plays a significant role and its impact on centrality is clearly higher than that of the economy. Fixed asset investment is an important measure to promote urban development, and the influence of consumption, industry, education and scientific research remains insufficient.
Based on the above analysis, it is evident that economic activity and the size of the population play a fundamental role in the centrality of a city. The cumulative contribution of other factors reflects the differences in the development of cities at different levels. The first- and second-class cities are basically located on the coast or are regional capital cities in the central and western regions of China, where all aspects of development are being sustained. The factors that control the long-term development of industry, consumption, research, education, etc., provide the main competitive advantages for these cities. In the third-class cities, the impact of industry, consumption, scientific research and education are relatively weak, however, the relative importance of transportation has increased significantly. Most of the fourth- and fifth-class cities are located in the central and western regions of the YREB, and the overall development is lagging behind that of the upper-tier cities. Factors such as construction of transportation facilities and fixed asset investment have become the main methods to promote the development of these cities and enhance their competitiveness. However, it is considered difficult for these cities to exploit industry, consumption, scientific research, and education and to secure competitive advantage in the near term.
4.3 Analysis of inter-city linkages
The mobility of city populations in the YREB has a significant correlation with the centrality score. The correlation coefficient between population inflows and outflows in the YREB and the centrality scores of cities is 0.9030 and 0.9257, respectively. The population entering the YREB from other cities in China is related to the centrality scores of cities in the YREB and the coefficient is 0.9508. The correlation coefficient between the population flowing out of the YREB to other cities in China and the centrality scores of cities in the YREB is 0.8613. The P values, 8.56E-49, 6.66E-56, 5.48E-67 and 1.84E-39, respectively, are all less than 0.01 (
| Classification | Correlation coefficient | P |
|---|---|---|
| The correlation coefficient between population inflows and the centrality scores of cities in the YREB | 0.9030 | 8.56E-49 |
| The correlation coefficient between population | 0.9257 | 6.66E-56 |
| The correlation coefficient between population entering the YREB from other cities in China and the centrality scores of cities in the YREB | 0.9508 | 5.48E-67 |
| The correlation coefficient between population flowing out of the YREB to other cities in China and the centrality scores of cities in the YREB | 0.8613 | 1.84E-39 |
Table 4.
The correlation coefficient between population flows and the centrality scores of cities in the Yangtze River Economic Belt
The inflow and outflow of population between cities decreases as the city class decreases. The population flow is mainly between high-class cities and between high-class and low-class cities, whereas the population flow is low between low-class cities (
![]()
Figure 7.
| The source city for population inflow from first-class cities | The source city for population inflow from second-class cities | The source city for population inflow from third-class cities | The source city for population inflow from fourth-class cities | The source city for population inflow for fifth-class cities | |||||
|---|---|---|---|---|---|---|---|---|---|
| Class | Proportion (%) | Class | Proportion (%) | Class | Proportion (%) | Class | Proportion (%) | Class | Proportion (%) |
| First | 55.01 | First | 35.85 | Second | 43.09 | Second | 33.81 | First | 43.15 |
| Second | 23.65 | Third | 23.43 | First | 28.25 | First | 31.06 | Fourth | 22.34 |
| Fourth | 13.78 | Second | 19.91 | Third | 14.86 | Fourth | 18.83 | Second | 19.76 |
| Fifth | 4.96 | Fourth | 17.71 | Fourth | 12.20 | Third | 11.58 | Fifth | 8.38 |
| Third | 2.59 | Fifth | 3.10 | Fifth | 1.60 | Fifth | 4.73 | Third | 6.38 |
Table 5.
The source city for population inflow from different classes of city in the Yangtze River Economic Belt
![]()
Figure 8.
| The destination city for the population outflow from first-class cities | The destination city for the population outflow from second-class cities | The destination city for the population outflow from third-class cities | The destination city for the population outflow from fourth-class cities | The destination city for the population outflow from fifth-class cities | |||||
|---|---|---|---|---|---|---|---|---|---|
| Class | Proportion (%) | Class | Proportion (%) | Class | Proportion (%) | Class | Proportion (%) | Class | Proportion (%) |
| First | 42.39 | First | 42.39 | Second | 38.11 | Second | 28.49 | First | 36.00 |
| Second | 22.47 | Second | 22.47 | First | 23.55 | First | 26.60 | Fourth | 28.46 |
| Fourth | 21.68 | Fourth | 21.68 | Fourth | 18.50 | Fourth | 25.50 | Second | 17.40 |
| Fifth | 7.91 | Fifth | 7.91 | Third | 17.85 | Third | 13.27 | Fifth | 10.48 |
| Third | 5.55 | Third | 5.55 | Fifth | 2.00 | Fifth | 6.15 | Third | 7.66 |
Table 6.
The destination city for the population outflow from different classes of city in the Yangtze River Economic Belt
The flow of urban population also reflects the strength of relationships between cities. With respect to the population flows between the upstream, midstream and downstream regions of the YREB, the proportion between the cities in the downstream regions was 35.52%, for the upstream regions 24.95% and the midstream regions 18.31%. The proportion from the upstream to the downstream cities was 7.83%, from the downstream to the upstream cities 7.28%, from the upstream to the midstream cities 2.29%, from the downstream to the midstream cities 1.82%, from the midstream to the upstream cities 1.66%, and from the midstream to the downstream cities 0.34%. These results reflect that the fact that the connections between the downstream cities are the closest, followed by the connections between the upstream cities; the connections between the midstream cities are weak and the connections between the midstream and the upstream or the downstream cities are weaker than the connections between the upstream and the downstream cities.
In general, Guangdong contributed the most in terms of having the largest population inflow to the YREB and being the largest population outflow destination from the YREB, followed by Beijing and the sum of the two accounted for 84.15% (inflow) and 78.76% (outflow) of the total population flow. For the first-, third-, fourth- and fifth-class cities, Guangdong and Beijing were also the top two cities for population inflow and outflow, both of which accounted for more than 70%. In the case of the second-class cities, Beijing and Guangdong occupied the first and second places for population inflow and population outflow, and the sum of the two accounted for 84.41% and 81.90%, respectively. Among the population outflow destinations, the proportion going to Beijing was significantly higher than that to Guangdong (
![]()
Figure 9.
| Source area of the population inflow for first-class cities | Source area for the population inflow for second-class cities | Source area for the population inflow for third-class cities | Source area for the population inflow for fourth-class cities | Source area for the population inflow for fifth-class cities | |||||
|---|---|---|---|---|---|---|---|---|---|
| Area Proportion (%) | Area Proportion (%) | Area Proportion (%) | Area Proportion (%) | Area Proportion (%) | |||||
| Guangdong | 45.32 | Beijing | 44.73 | Guangdong | 61.27 | Guangdong | 59.70 | Guangdong | 55.08% |
| Beijing | 34.38 | Guangdong | 39.68 | Beijing | 29.68 | Beijing | 25.77 | Beijing | 33.12 |
| Jilin | 4.50 | Guangxi | 4.51 | Henan | 3.11 | Fujian | 5.43 | Fujian | 3.45 |
| Hainan | 4.45 | Jilin | 3.62 | Fujian | 1.77 | Guangxi | 2.63 | Henan | 2.49 |
| Shaanxi | 3.45 | Shandong | 2.00 | Shandong | 1.25 | Henan | 2.06 | Tibet | 1.46 |
| Tianjin | 3.06 | Henan | 1.36 | Shaanxi | 0.68 | Shaanxi | 0.98 | Hainan | 1.43 |
| Liaoning | 1.54 | Tianjin | 1.21 | Heilongjiang | 0.38 | Hainan | 0.93 | Guangxi | 0.77 |
| Hong Kong | 1.54 | Shaanxi | 1.12 | Guangxi | 0.38 | Tianjin | 0.91 | Shandong | 0.75 |
| Fujian | 0.79 | Hainan | 0.87 | Liaoning | 0.38 | Hebei | 0.42 | Shaanxi | 0.59 |
| Tibet | 0.72 | Hebei | 0.32 | Tianjin | 0.34 | Liaoning | 0.41 | Tianjin | 0.23 |
| Shandong | 0.14 | Heilongjiang | 0.26 | Jilin | 0.19 | Tibet | 0.23 | Hebei | 0.22 |
| Inner Mongolia | 0.11 | Inner Mongolia | 0.14 | Hainan | 0.14 | Shandong | 0.19 | Liaoning | 0.14 |
| — | — | Gansu | 0.11 | Gansu | 0.14 | Jilin | 0.13 | Jilin | 0.12 |
| — | — | Liaoning | 0.07 | Tibet | 0.14 | Gansu | 0.10 | Gansu | 0.08 |
| — | — | — | — | Ningxia | 0.10 | Shanxi | 0.03 | Xinjiang | 0.04 |
| — | — | — | — | Hebei | 0.04 | Heilongjiang | 0.03 | Shanxi | 0.04 |
| — | — | — | — | Shanxi | 0.01 | Inner Mongolia | 0.03 | — | — |
| — | — | — | — | Qinghai | 0.01 | Macao | 0.03 | — | — |
Table 7.
Source areas (outside the YREB) for population inflow for different classes of city in the Yangtze River Economic Belt
| Destination area for the first-class city outflow population | Destination area for the second-class city outflow population | Destination area for the third-class city outflow population | Destination area for | Destination area for the fifth-class city outflow population | |||||
|---|---|---|---|---|---|---|---|---|---|
| Area proportion (%) | Area proportion (%) | Area proportion (%) | Area proportion (%) | Area proportion (%) | |||||
| Guangdong | 37.59 | Beijing | 49.46 | Guangdong | 43.24 | Guangdong | 47.26 | Guangdong | 46.21 |
| Beijing | 37.18 | Guangdong | 32.44 | Beijing | 40.21 | Beijing | 31.46 | Beijing | 38.21 |
| Hainan | 5.16 | Guangxi | 3.59 | Henan | 7.17 | Fujian | 5.57 | Fujian | 4.13 |
| Jilin | 3.94 | Henan | 3.52 | Shandong | 2.09 | Henan | 4.89 | Henan | 4.09 |
| Tianjin | 3.91 | Shandong | 3.28 | Shaanxi | 1.22 | Guangxi | 3.51 | Shandong | 1.65 |
| Shaanxi | 3.33 | Jilin | 3.12 | Fujian | 1.20 | Shaanxi | 2.17 | Tibet | 1.61 |
| Hong Kong | 2.33 | Shaanxi | 1.07 | Jilin | 0.96 | Tianjin | 1.39 | Hainan | 1.13 |
| Shandong | 2.30 | Tianjin | 0.89 | Heilongjiang | 0.82 | Hainan | 1.04 | Shaanxi | 1.10 |
| Liaoning | 1.79 | Fujian | 0.79 | Guangxi | 0.81 | Shandong | 0.71 | Guangxi | 0.99 |
| Tibet | 1.48 | Hebei | 0.49 | Liaoning | 0.63 | Liaoning | 0.67 | Tianjin | 0.49 |
| Fujian | 0.85 | Hainan | 0.48 | Tianjin | 0.60 | Hebei | 0.54 | Shanxi | 0.18 |
| Inner Mongolia | 0.14 | Heilongjiang | 0.45 | Tibet | 0.31 | Tibet | 0.34 | Hebei | 0.10 |
| — | — | Inner Mongolia | 0.24 | Gansu | 0.24 | Gansu | 0.22 | Gansu | 0.07 |
| — | — | Liaoning | 0.17 | Hebei | 0.21 | Jilin | 0.11 | Liaoning | 0.04 |
| — | — | — | — | Hainan | 0.19 | Inner Mongolia | 0.05 | Ningxia | 0.01 |
| — | — | — | — | Hong Kong | 0.10 | Heilongjiang | 0.05 | — | — |
| — | — | — | — | Shanxi | 0.01 | Macao | 0.03 | — | — |
| — | — | — | — | — | — | Shanxi | 0.02 | — | — |
Table 8.
Destination areas (outside the YREB) for population outflow for different classes of city in the Yangtze River Economic Belt
![]()
Figure 10.
Overall, the YREB is more connected to Guangdong than to Beijing because Guangdong is closer to the YREB and has a larger population than Beijing. The second-class cities are more connected to Beijing than Guangdong, mainly because the second-class cities are mostly provincial capital cities having excellent transportation hubs, such that exchanges with Beijing are more extensive. The cities in the YREB are closely linked to Guangdong and Beijing, reflecting Guangdong’s strong economic status and its geographic proximity to the YREB. The results are also a reflection of Beijing’s enormous influence as the national political and cultural center.
5 Conclusions and discussion
5.1 Conclusions
(1) The basic characteristics of cities in the YREB largely conform to the point axis theory and central geography theory. Two axes are connected in series with the cities of the YREB: one axis is the Yangtze River with Shanghai, Suzhou, Wuhan, Chongqing, and Chengdu acting as key nodes along the connecting line; the other is the Shanghai-Kunming railway route, which links Shanghai, Hangzhou, Nanchang, Changsha, and Guiyang, with the cities acting as important nodes. With the above cities positioned centrally, a city hierarchy for the region has been developed. The level of urban centrality for the downstream area is more extensive than that for the middle and upper reaches. The downstream gradient positioned around Shanghai and Suzhou is relatively gentle, and the urban system is more mature. The gradient in the middle and upper reaches is steeper and even transits directly from the highest centrality level to the lowest level where the urban system is underdeveloped.
(2) The factors influencing urban centrality in the YREB largely conform to comparative and late-developing advantage theories. Although the GDP and the total permanent residential population are basic factors in cities of different classes, other factors have different impacts on cities of different classes and on the regions. For the first- and second-class cities and for the lower reaches of the Yangtze River, higher education, R&D and high-tech industries, social consumption, and transportation are the main influencing factors. In the third-, fourth- and fifth-class cities and in the middle and upper reaches of the Yangtze River, fixed asset investment and tourism income are the main influencing factors, reflecting the comparative advantages of cities with different development levels. However, in the third-, fourth- and fifth-class cities and for the middle and upper reaches of the Yangtze River, the impact of transportation is particularly significant. In particular, with the development of aviation and high-speed or express railways, the impact of external traffic on the previously underdeveloped areas has been substantial and transformative in terms of developing a recent competitive advantage.
(3) The mobility of populations is significantly correlated with centrality of cities. The degree of connectivity of cities in the YREB is positively correlated with city class. As stated earlier, there are two axes that align in the east-west direction, namely, the Yangtze River and the Shanghai-Kunming railway line. Moreover, the complexities of the connectivities between cities are positively correlated with the degree of economic development. Shanghai, Chongqing, Suzhou, Chengdu, Wuhan, and other provincial capitals have higher migration and stronger links. However, fewer cities are connected with similar cities of the same class. Also, the connectivities between the midstream cities and the upstream or downstream cities are weaker than those between the upstream cities and downstream cities. For areas outside the YREB, Guangdong and Beijing are the two regions most closely linked.
5.2 Discussion
(1) Analysis of social and economic data can yield insights into the economic development of the city in a general way; however, a sustainable ecological environment is also an important direction for urban development in the future. As one of the most dynamic factors in society, the migration of people reflects the connectivity between cities; furthermore, logistics and information flow are important factors for establishing connectivity between cities. To maintain the integrity of the study area, the indexes of ecological environment, logistics, and information flow were not included in the present analysis because of the difficulty of securing data in some areas. The study of the ecological value of the area and the human settlement environment, as well as logistics and information flow, will be important elements to address in follow-up studies on urban centrality and linkages.
(2) Cities with high levels of centrality can exert a strong agglomeration effect, take advantage of the economies of scale, and improve resource utilization efficiency. However, these impacts may result in drastic changes to population, industry, and resources of the surrounding cities. Within these cities there may also be problems due to overcrowding, housing shortages, and traffic congestion. A city with low centrality faces the opposite challenges. Starting from a low level of centrality, the scientific analysis of strategies to control a city’s centrality, rationally lay out cities with different levels of centrality, and effectively oversee the development of cities and adjoining regions deserves further study.
(3) At present, research on city centrality is under similar methods, but the development background of each city differs by region. The population represents the core and main body of the city in new urbanizations, and because people differ in their needs and aspirations, the development background of different cities varies. Questions that need to be posed include: can the development of the future city be ‘decentralized’ and take the form of an open, flat, and equal urban network, and can we create a unique urban pattern?
References
[1] W Christaller. Central Place in Southern Germany. Baskin C W trans., 1966. Englewood Cliffs(1933).
[2] C Fang D, Y Sun M. Influence of core cities in Yangtze River Economic Belt. Economic Geography, 35, 76-81, 20(2015).
[3] H Feng X, X Zhong Y, R Li Z et al. Evolvement of spatial pattern of urban system in the economic belt of Yangtze River. Resources and Environment in the Yangtze Basin, 26, 1721-1733(2017).
[4] Z Gao J, W Zheng H, Z Liu Y. Diagnosis of the multi-functionality of land use based on an entropy weight TOPSIS model. Resources and Environment in the Yangtze Basin, 27, 2496-2504(2018).
[5] L Henri. The Sociology of Marx. Norbert G trans., 1968.(1966).
[6] L Henri. The Urban Revolution. Robert B trans., 2003.(1970).
[7] K Hong H, P Liao H, F Wei C et al. Health assessment of a land use system used in the ecologically sensitive area of the Three Gorges Reservoir Area, based on the improved TOPSIS method. Acta Ecologica Sinica, 35, 8016-8027(2015).
[9] G Jin, K Chen, P Wang et al. Trade-offs in land-use competition and sustainable land development in the North China Plain. Technological Forecasting and Social Change, 141, 36-46(2019).
[10] G Jin, Z Deng X, X Chu et al. Optimization of land-use management for ecosystem service improvement: A review. Physics and Chemistry of the Earth, 101, 70-77(2017).
[12] G Jin, H Li Z, Z Deng X et al. An analysis of spatiotemporal patterns in Chinese agricultural productivity between 2004 and 2014. Ecological Indicators, 105, 591-600(2018).
[13] P Lei X, Q Robin, Y Liu. Evaluation of regional land use performance based on entropy TOPSIS model and diagnosis of its obstacle factors. Transactions of the Chinese Society of Agricultural Engineering, 32, 243-253(2016).
[14] D Li, N You Y, C F Ma et al. Analysis on the differentiation characteristics of spatial poverty and its influencing factors in the oasis towns of arid areas: Taking three south Xinjiang districts as an example. World Regional Studies, 27, 89-101(2018).
[17] M Luo. Research on urban centricity of Yangtze River’s Midstream Urban Agglomeration [D]. Wuhan: Central China Normal University. .(2017).
[19] U Marshall J. The Structure of Urban Systems.(1989).
[20] M Ning Y, M Yan Z. The uneven development and spatial diffusion of Chinese central cities. Acta Geographica Sinica, 48, 97-104(1993).
[21] Y Peng D, J Xiao R, J Wang et al. The competitiveness evaluation for the cities in the Yangtze River Economic Belt based on factor analysis. Journal of Nanchang University (Natural Science), 40, 97-102(2016).
[22] B Phillip. Power and centrality: A family of measures. American Journal of Sociology, 92, 1170-1182(1987).
[23] E Preston R. Two centrality models. Yearbook of Association of Pacific Coast Geographers, 32, 59-78(1970).
[26] D Sun B, H Xu J, C Feng Z. Analysis on the urban centricity and urban development of Liaoning Province. Human Geography, 23, 77-81(2008).
[27] L Tian M, M Liu S, Y Kou. Evaluation on the functions of national central cities and spatial temporal evaluation of their competitiveness. City Planning Review, 37, 89-95(2013).
[28] B Wang Z, K Luo, J Song et al. Characteristics of change and strategic considerations of the structure of urban functional divisions in the Yangtze River Economic Belt since 2000. Progress in Geography, 34, 1409-1418(2015).
[29] J Wen. A study on the urban centricity of Wuhan Urban Circle. Wuhan: Central China Normal University(2009).
[30] L Wu Y, D Liu Z. A study on city centricity and urban development in Shandong province. Territory & Natural Resources Study, 8-9(2010).
[31] F Xue L, J Ou X, Q Tan H. Evaluation of urban centricity based on entropy method: A case study of Huaihai Economic Zone. Geography and Geo-Information Science, 25, 63-66(2009).
[32] S Zhang G, W Ding Z, M Xu Y et al. Study on urban system hierarchy level structure in Henan Province: Based on the analysis of the New Urbanization Strategy of Henan Province. Areal Research and Development, 33, 46-51(2014).
[33] Y Zhao. Research on the spatial poverty trap of concentrated contiguous areas with particular difficulties on basis of the geographic capital: Taking Longde County of Ningxia for example. Yinchuan: Ningxia University(2015).
[34] X Zhong Y, H Feng X. The evolution of urban functional structure from the perspective of multiscale in the Yangtze River Economic Belt. Journal of Nantong University (Social Sciences Edition), 34, 34-40(2018).
[35] X Zhou Y, L Zhang, Y Wu. Study of China’s urban centrality hierarchy. Regional Areal Research and Development, 20, 1-5(2001).
[36] H Zou, J Duan X. Summary reviews of studies on the Yangtze River Economic Belt. Resources and Environment in the Yangtze Basin, 24, 1672-1682(2015).


Set citation alerts for the article
Please enter your email address

© Copyright 2018-2021 | Chinese Laser Press. All Rights Reserved 沪ICP备15018463号-20