
Xiwei Xie, Jing Hu, Yibing Shen. Phase Imaging Based on Random Coding Modulation of Digital Micro-Mirror Device[J]. Acta Optica Sinica, 2020, 40(23): 2311001
- Acta Optica Sinica
- Vol. 40, Issue 23, 2311001 (2020)
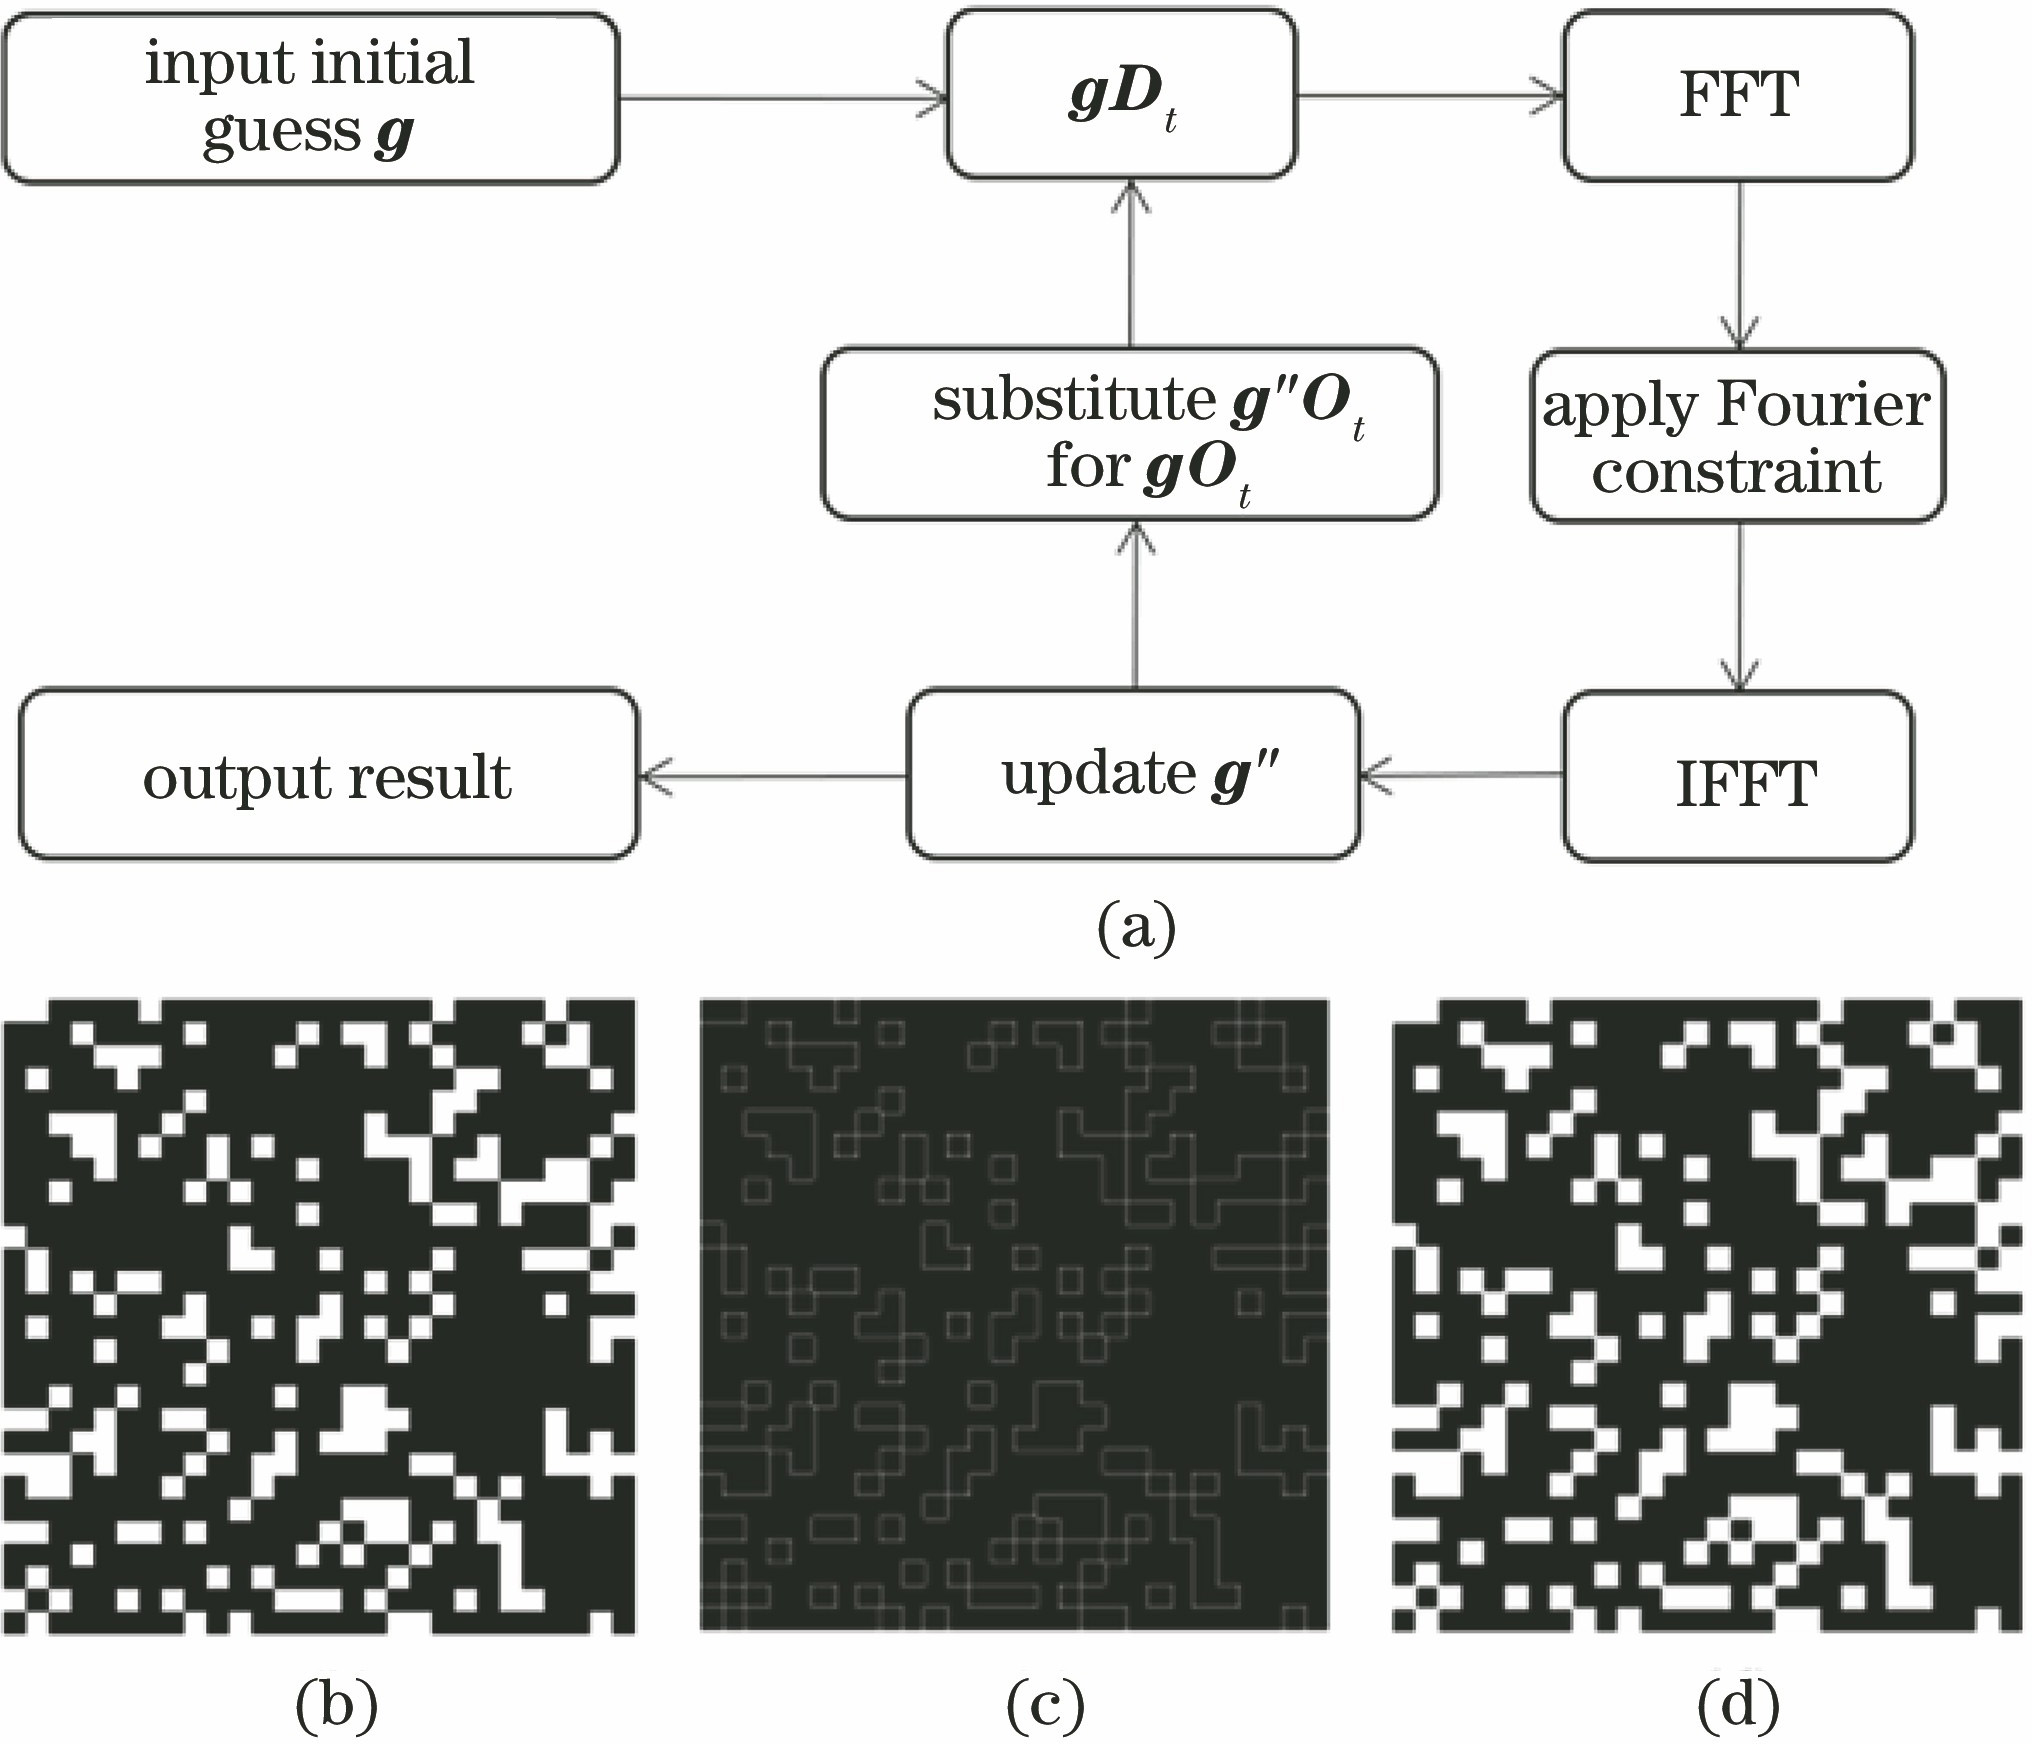
Fig. 1. Flow chart of reconstruction process and expansion process. (a) Flow chart of reconstruction process; (b) initial coding pattern. White area indicates transmission part, similarly hereinafter; (c) expanded region; (d) expanded coding pattern
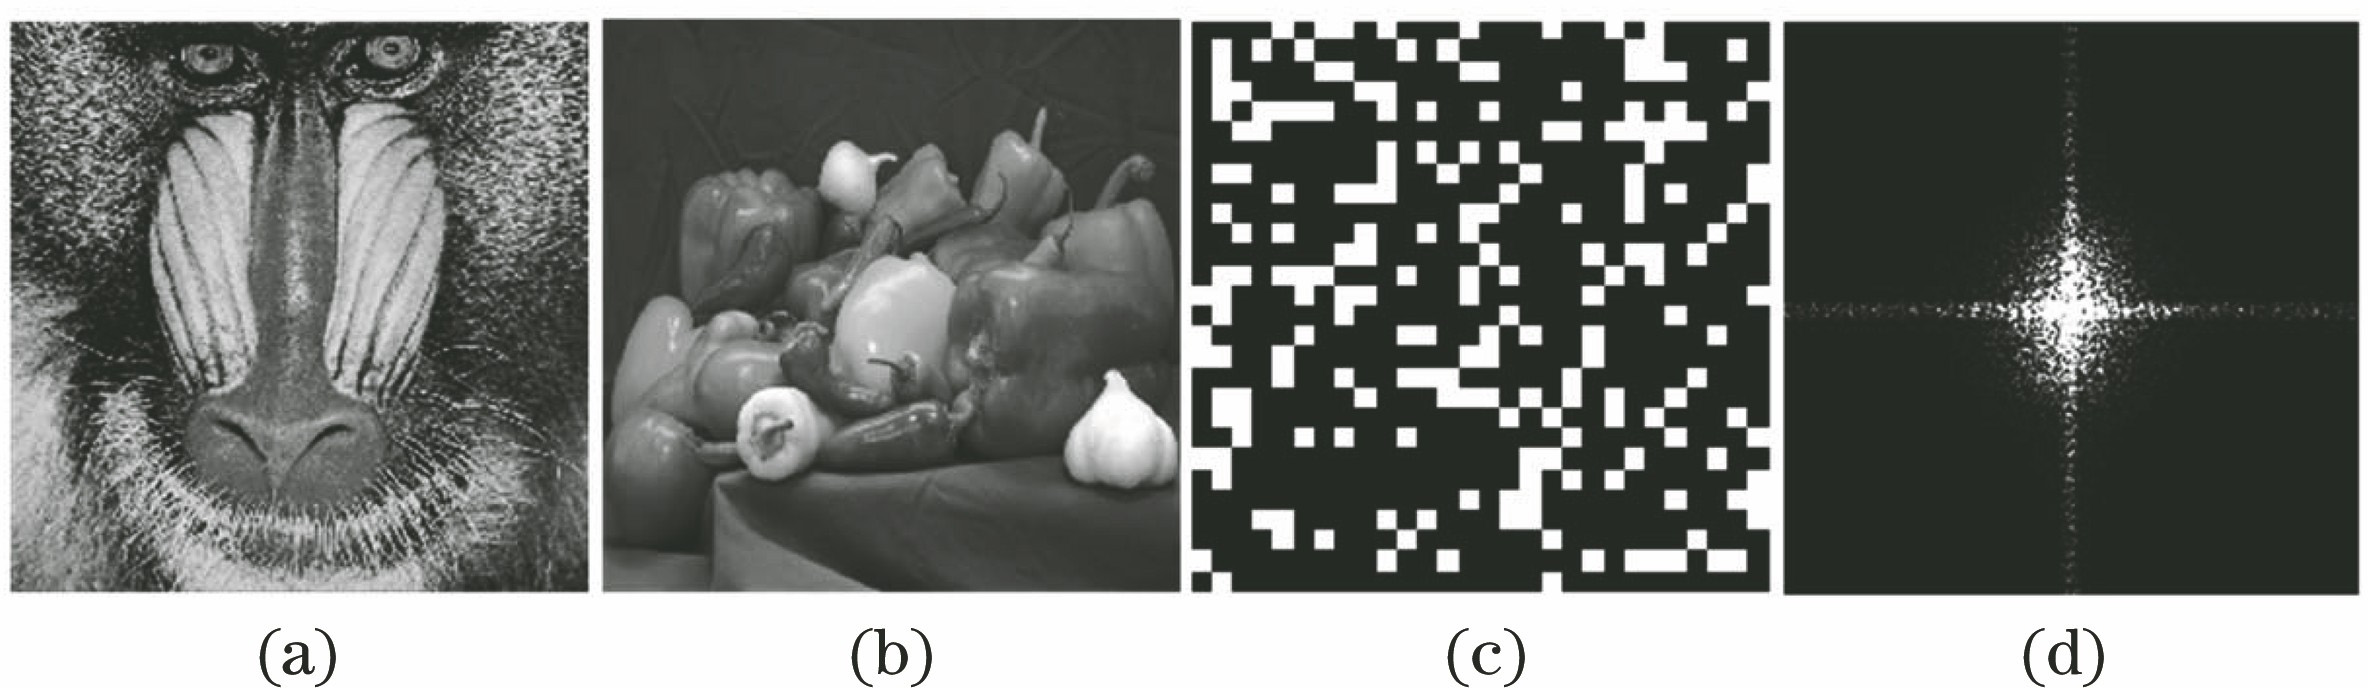
Fig. 2. Intensity and phase of object to be recovered, random coding pattern loaded on DMD, and Fourier frequency spectrum intensity. (a) Intensity of object to be recovered; (b) phase of object to be recovered; (c) random coding pattern loaded on DMD; (d) Fourier frequency spectrum intensity
Fig. 3. Simulation results. (a)(b) Effects of different modulation unit sizes on intensity and phase of reconstructed image; (c)(d) effect of Rd on intensity and phase of reconstructed image
Fig. 4. Simulation results for different modulation unit sizes. (a)-(d) Reconstructed intensity results corresponding to p=1,10,20,40; (e)-(h) reconstructed phase results corresponding to p=1,10,20,40
Fig. 5. Comparison of curves of different methods (solid line and dotted line represent intensity and phase, respectively). (a) RMSE; (b) SSIM
Fig. 6. Recovered results of different methods. (a)(e) Recovered intensity and phase results of method proposed in this paper; (b)(f) recovered results of PIE; (c)(g) recovered results of SBMIR; (d)(h) recovered results of modified Gauss-Newton method
Fig. 7. Experimental setup
Fig. 8. Experimental reconstruction results. (a) Retrieval result of USAF test target. Illustration is enlarged region of element 2 of group 6; (b) intensity distribution of line pair along black lines in illustration
Fig. 9. Experimental reconstruction results. (a)-(c) Recovered intensity and phase of human hair follicle cells (captured by CCD camera); (e)-(g) recovered intensity and phase of plant stem (captured by CCD camera); (d)(h) phase recovery results of plant stem and human hair follicle without calibration
Fig. 10. Root mean square error curves of Fourier spectrum intensity of recovery results of different algorithms and experimentally measured intensity
Fig. 11. Reconstruction results of ASR, ER, and SF algorithms. (a)(d) ASR; (b)(e) ER; (c)(f) SF

Set citation alerts for the article
Please enter your email address
© Copyright 2018-2021 | Chinese Laser Press. All Rights Reserved 沪ICP备15018463号-20