
Yuqing Yang, Xiaojing Guo. Finger-Vein Image Enhancement Method Combining Weber Law and Gabor Filtering[J]. Laser & Optoelectronics Progress, 2021, 58(14): 1410003
- Laser & Optoelectronics Progress
- Vol. 58, Issue 14, 1410003 (2021)
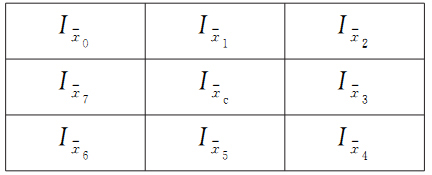
Fig. 1. 3×3 neighbors in WLD region
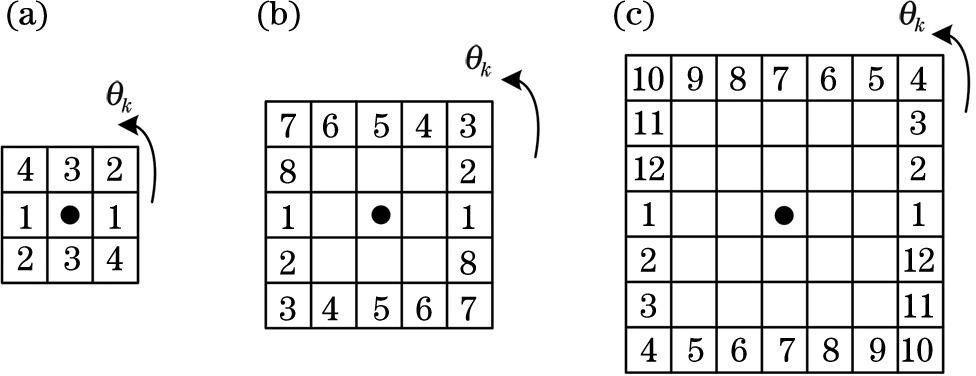
Fig. 2. Three different neighborhoods of WLD. (a) n=3, K=4; (b) n=5, K=8; (c) n=7, K=12
Fig. 3. Enhancement examples. (a) Some original finger-vein images; (b) enhanced results using 3×3 blocks with 4 orientations (n=3); (c) enhanced results using 5×5 blocks with 8 orientations (n=5); (d) enhanced results using 7×7 blocks with 12 orientations (n=7)
Fig. 4. Finger-vein ROI images. (a) Data-1; (b) Data-2
Fig. 5. Enhancement methods with different combinations of Gabor and WLD. (a) Data-1; (b) Data-2
Fig. 6. ROC curves of different enhancement methods. (a) Data-1; (b) Data-2
Fig. 7. ROC curves of different comparison methods. (a) Data-1; (b) Data-2
| ||||||||||||||||||||||||||||||||||||||||
Table 1. EER of WLD in different neighborhoods and Gabor in different scales
|
Table 2. ERR with different enhancement methods
| |||||||||||||||||||||||||||||||||||||||||
Table 3. Recognition results of different comparison methods

Set citation alerts for the article
Please enter your email address
© Copyright 2018-2021 | Chinese Laser Press. All Rights Reserved 沪ICP备15018463号-20