
Songze Bao, Xing Zhong, Ruifei Zhu, Shuhai Yu, Ye Yu, Lanmin Li. Automatic Detection Method of Ships Based on Shortwave Infrared Remote Sensing Images[J]. Acta Optica Sinica, 2018, 38(5): 0528001
- Acta Optica Sinica
- Vol. 38, Issue 5, 0528001 (2018)
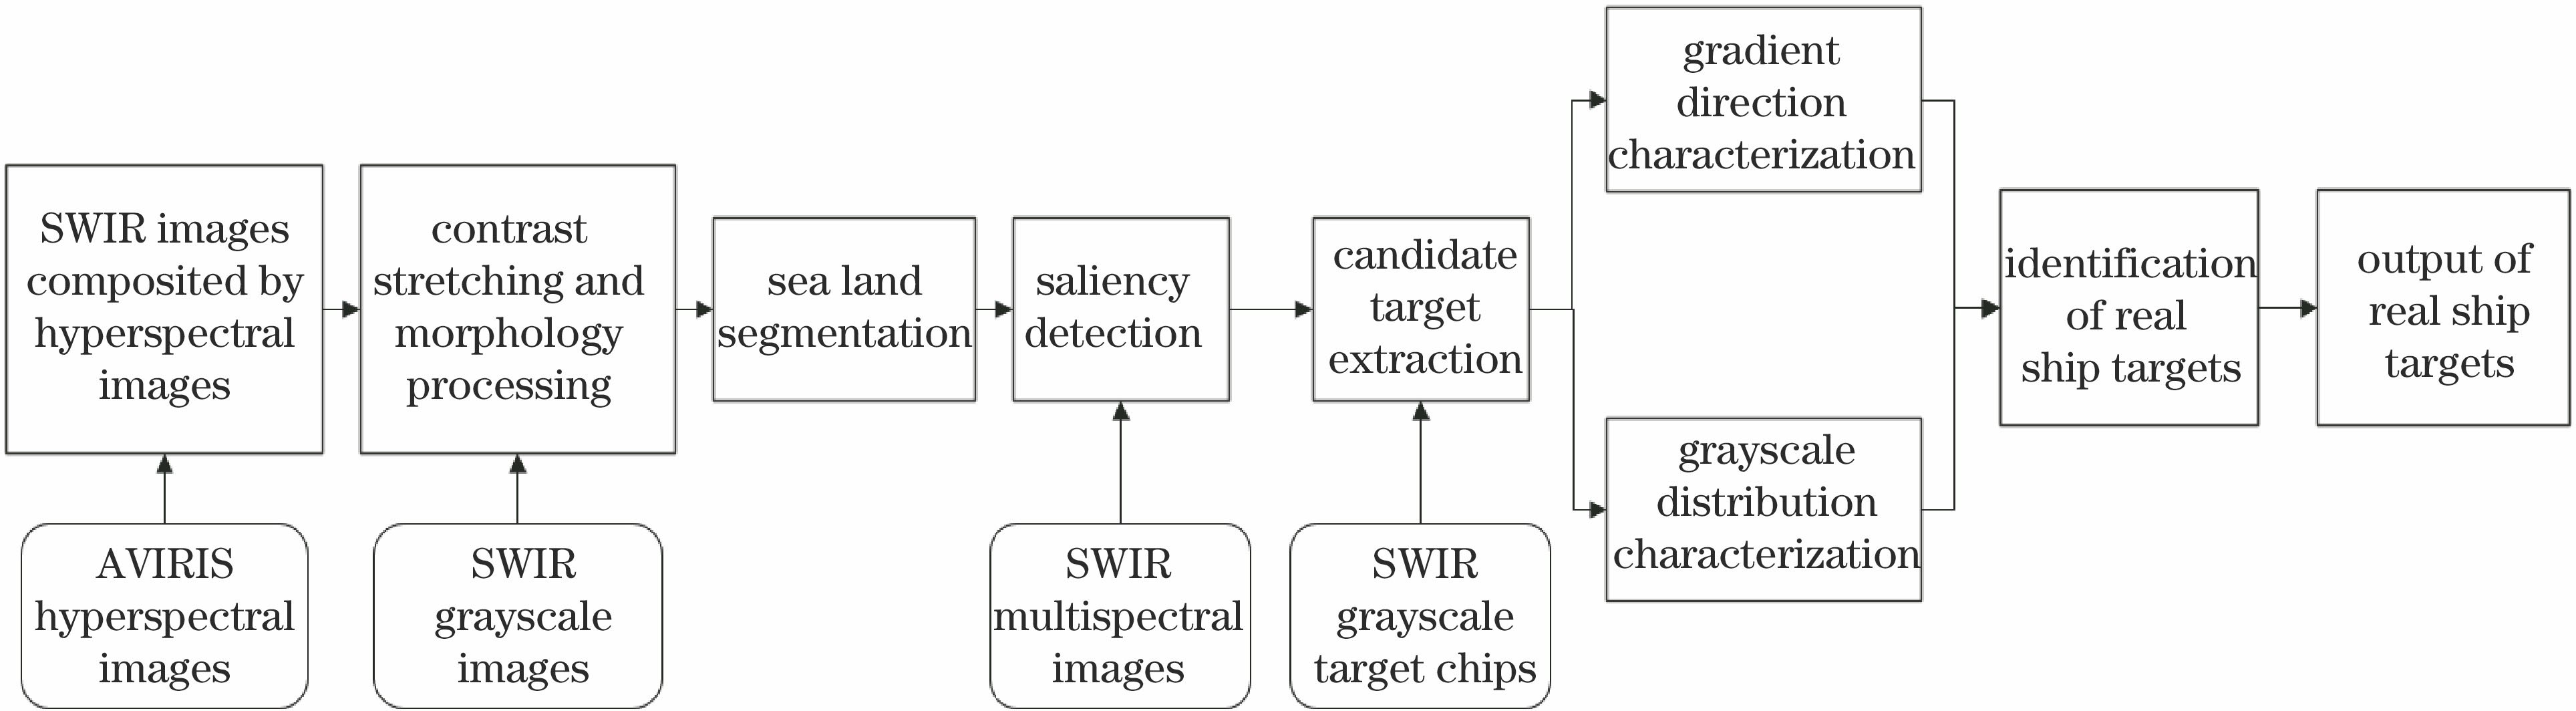
Fig. 1. Flow chart of automatic detection method of ships based on SWIR images
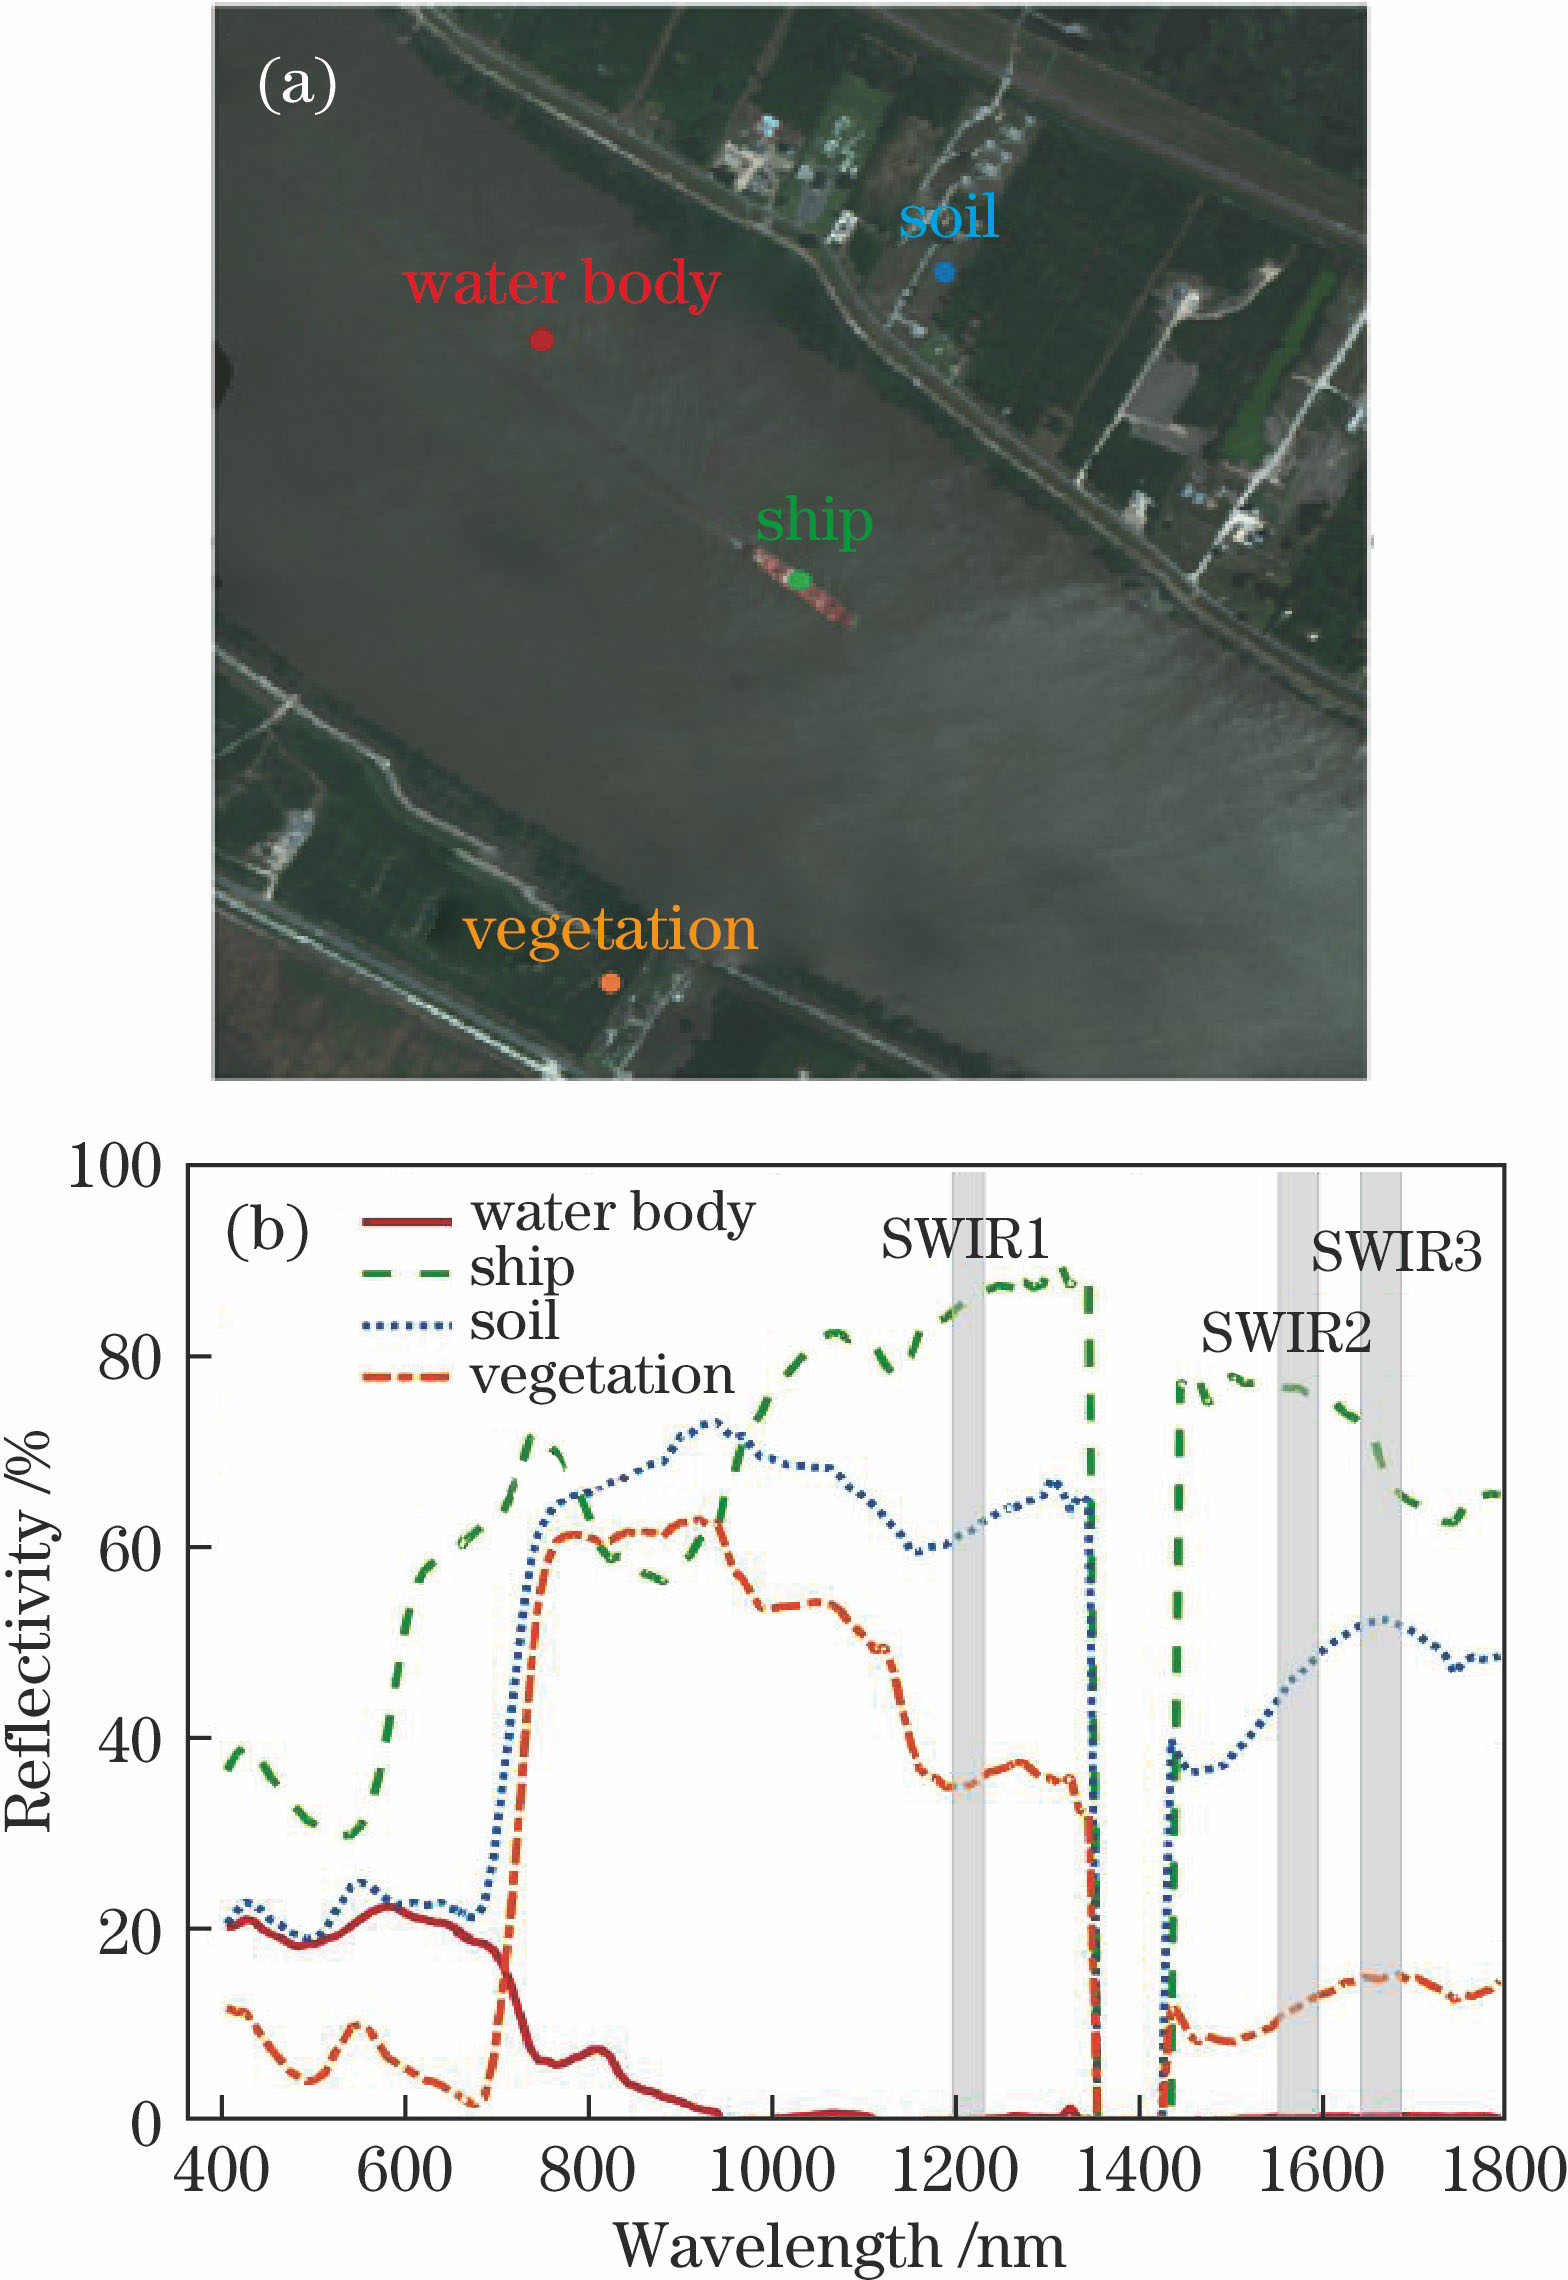
Fig. 2. (a) Scene image; (b) reflectance curves of typical features
Fig. 3. (a) Intensity image I; (b) contrast stretched image I'; (c) land mask; (d) land mask filled in holes; (e) water mask
Fig. 4. Saliency detection and target chip extraction. (a)(f) Input SWIR image; (b)(g) visible image of same scene (targets marked manually); (c)(h) saliency image; (d)(i) mask image of candidate targets; (e)(j) SWIR image chip of candidate targets
Fig. 5. Rotation and translation of main axis of ships by Radon transform
Fig. 6. Gray-scale distribution characteristics of target chips. (a) Schematic of direction and regional segmentation; (b) image in polar coordinate; (c) gray-scale distribution curve; (d) gray-scale distribution histogram
Fig. 7. S-HOG descriptor. (a) Regional segmentation; (b) histogram of oriented gradient of region B1 in Fig. 7(a)
Fig. 8. Geometric characterization of target chips. (a) Prescreened target chips; (b) grayscale distribution curve; (c) grayscale distribution histogram; (d) gradient oriented histogram
Fig. 9. Detection results comparison of visible image and SWIR image. (a)(e) Input images; (b)(f) saliency map under CSM model; (c)(g) results of saliency segmentation; (d)(h) results of target discrimination
Fig. 10. Ship detection results in various scenes by proposed method
Fig. 11. Effect of parameter value on detection performance. (a) Accuracy index versus δ; (b) Re for each constraint factor; (c) fDR for each constraint factor
|
Table 1. Detection results for different input images
|
Table 2. Detection results for different methods

Set citation alerts for the article
Please enter your email address
© Copyright 2018-2021 | Chinese Laser Press. All Rights Reserved 沪ICP备15018463号-20