
Jiali Li, Wanling Hong, Chunliu Zhao, Rui Xu, Ben Xu, Changyu Shen, Dongning Wang. Multi-Point Optical Fiber Hydrogen Sensor with Fabry-Perot Interferometers Using Arrayed Waveguide Grating[J]. Acta Optica Sinica, 2021, 41(13): 1306013
- Acta Optica Sinica
- Vol. 41, Issue 13, 1306013 (2021)
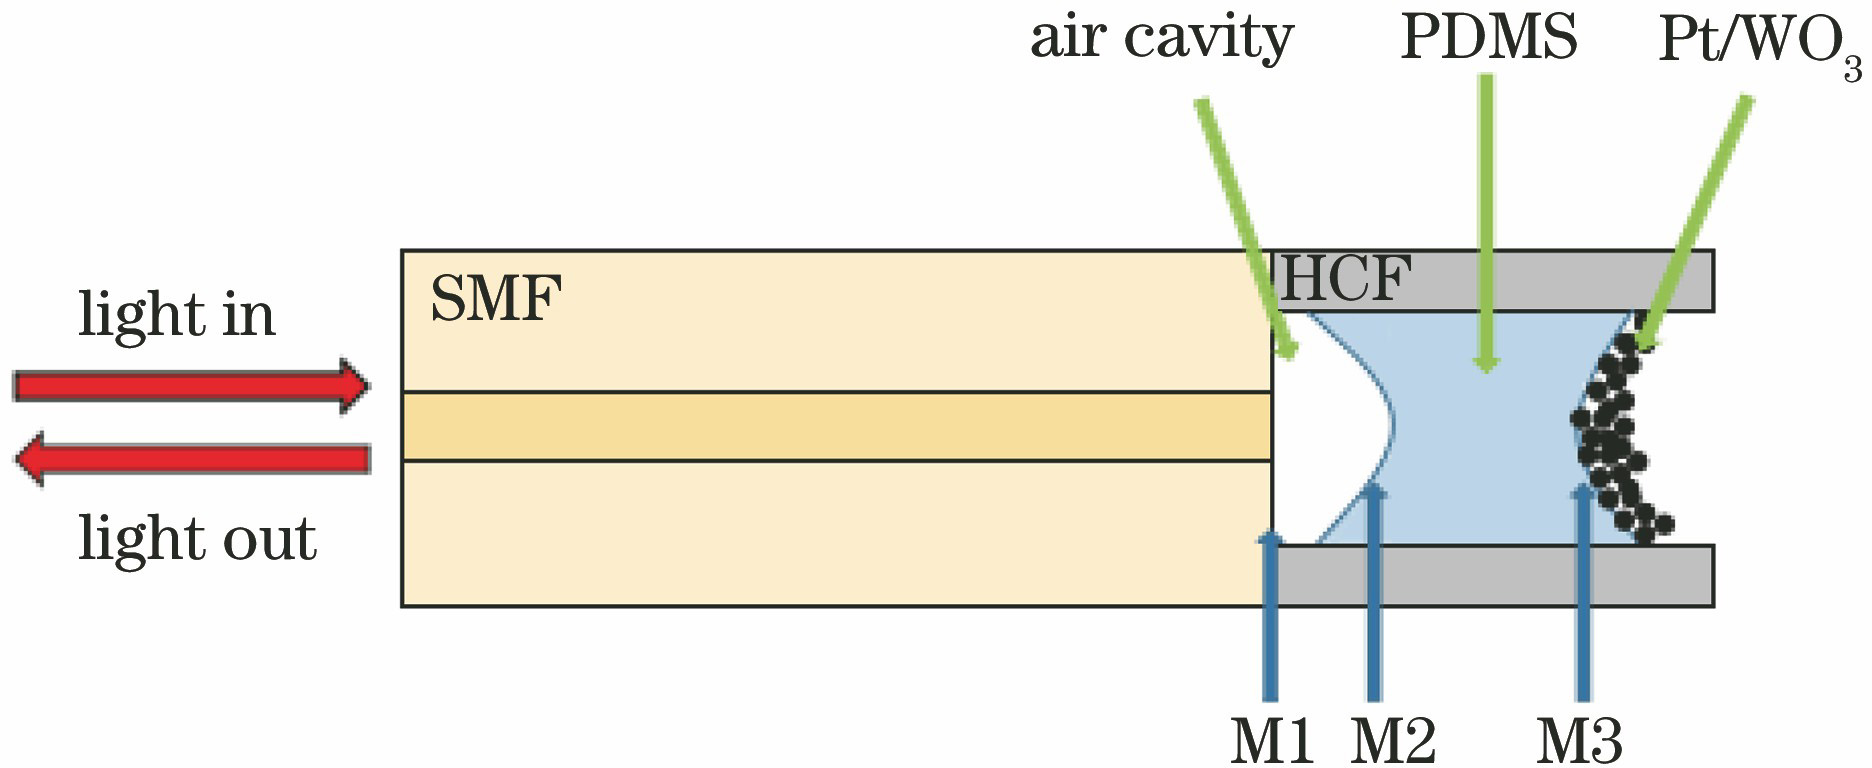
Fig. 1. Schematic diagram of optical fiber FPI hydrogen sensor based on PDMS filling
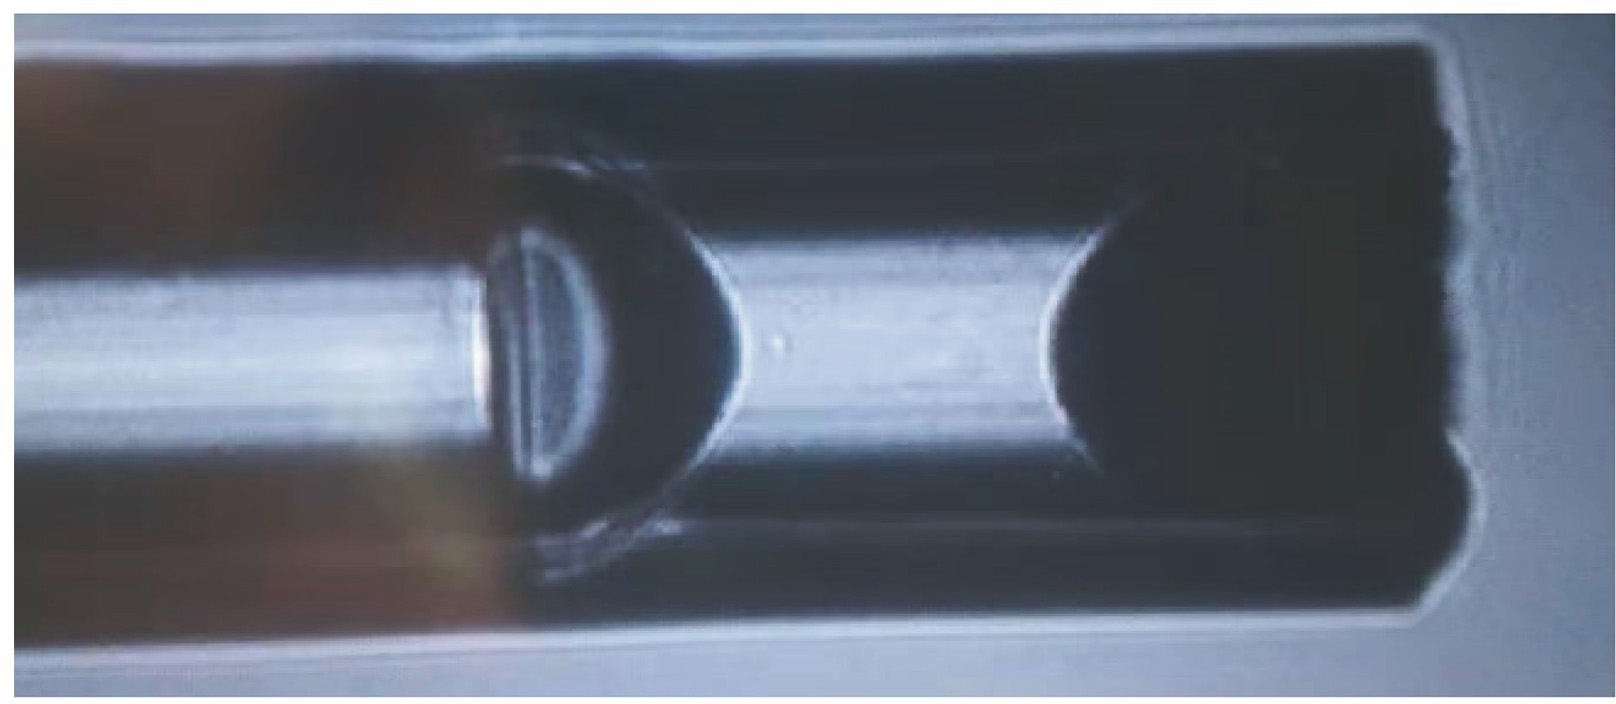
Fig. 2. Physical image of optical fiber FPI hydrogen sensor based on PDMS filling
Fig. 3. Principle diagram of multi-point measurement multiplexing based on AWG. (a) When FPI completely matches the mth channel; (b) when FPI spectrum changes with temperature; (c) relationship between FPI wavelength shift and AWG intensity
Fig. 4. Experimental device diagram of single-point hydrogen concentration measurement
Fig. 5. Experimental device diagram of multi-point hydrogen concentration measurement
Fig. 6. Reflectance spectra of two sensors from 30 ℃ to 70 ℃. (a) FPI 1; (b) FPI 2
Fig. 7. Relationships between wavelength shift of two sensors and temperature increasing. (a) FPI 1; (b) FPI 2
Fig. 8. Reflectance spectra of two sensors in hydrogen volume fraction range of 1.0%--5.0%. (a) FPI 1; (b) FPI 2
Fig. 9. Relationships between wavelength shift of two sensors and hydrogen concentration. (a) FPI 1; (b) FPI 2
Fig. 10. Reflectance spectra of multi-point hydrogen sensor in hydrogen volume fraction range of 1.0%--4.0%
Fig. 11. Relationships between intensity change of two channels and hydrogen concentration. (a) The 1st channel; (b) the 13th channel

Set citation alerts for the article
Please enter your email address
© Copyright 2018-2021 | Chinese Laser Press. All Rights Reserved 沪ICP备15018463号-20