• Acta Optica Sinica
  • Vol. 40, Issue 9, 0901001 (2020)
Taiping Yang1、2, Fuqi Si1、*, Wang Ping3, Yuhan Luo1, Haijin Zhou1, and Minjie Zhao1
Author Affiliations
  • 1Centre of Environmental Optics, Anhui Institute of Optics and Fine Mechanics, Chinese Academy of Sciences, Hefei, Anhui 230031, China
  • 2University of Science and Technology of China, Hefei, Anhui 230026, China
  • 3Royal Netherlands Meteorological Institute, KNMI, De Bilt, 3731GA, The Netherlands
  • show less
    DOI: 10.3788/AOS202040.0901001 Cite this Article Set citation alerts
    Taiping Yang, Fuqi Si, Wang Ping, Yuhan Luo, Haijin Zhou, Minjie Zhao. Research on Cloud Fraction Inversion Algorithm of Environmental Trace Gas Monitoring Instrument[J]. Acta Optica Sinica, 2020, 40(9): 0901001 Copy Citation Text show less
    Flowchart of proposed algorithm
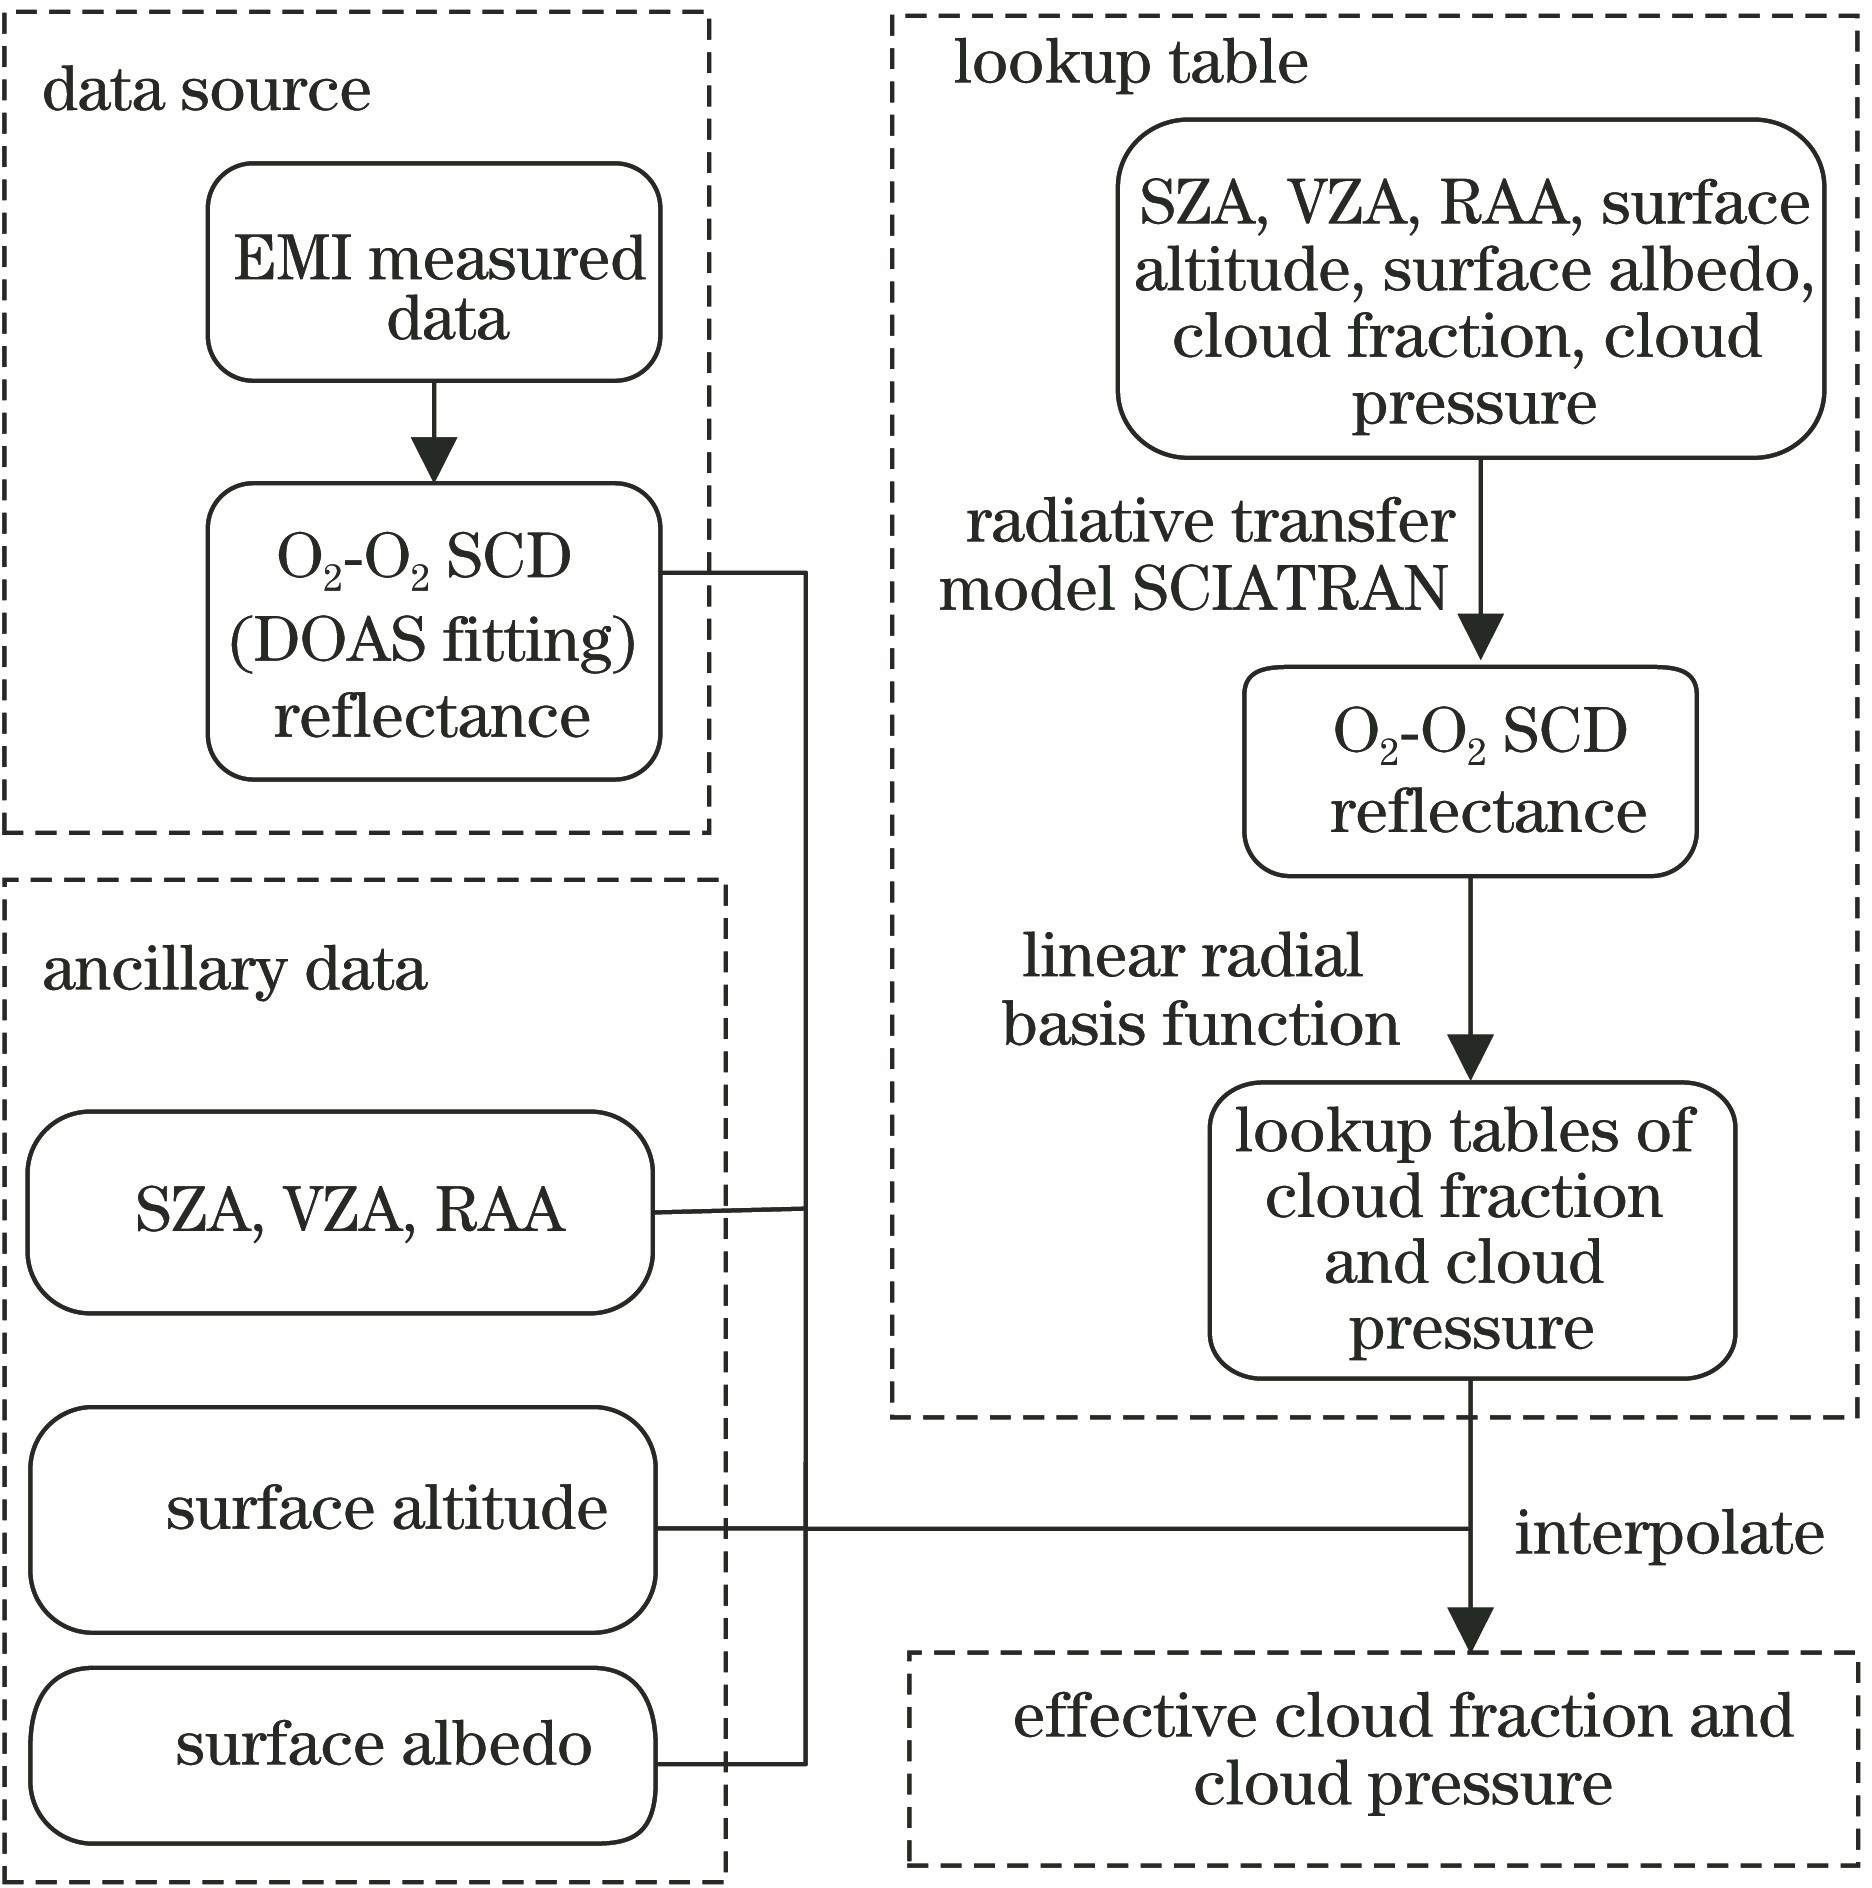
    Fig. 1. Flowchart of proposed algorithm
    Push-broom diagram of EMI in a nadir
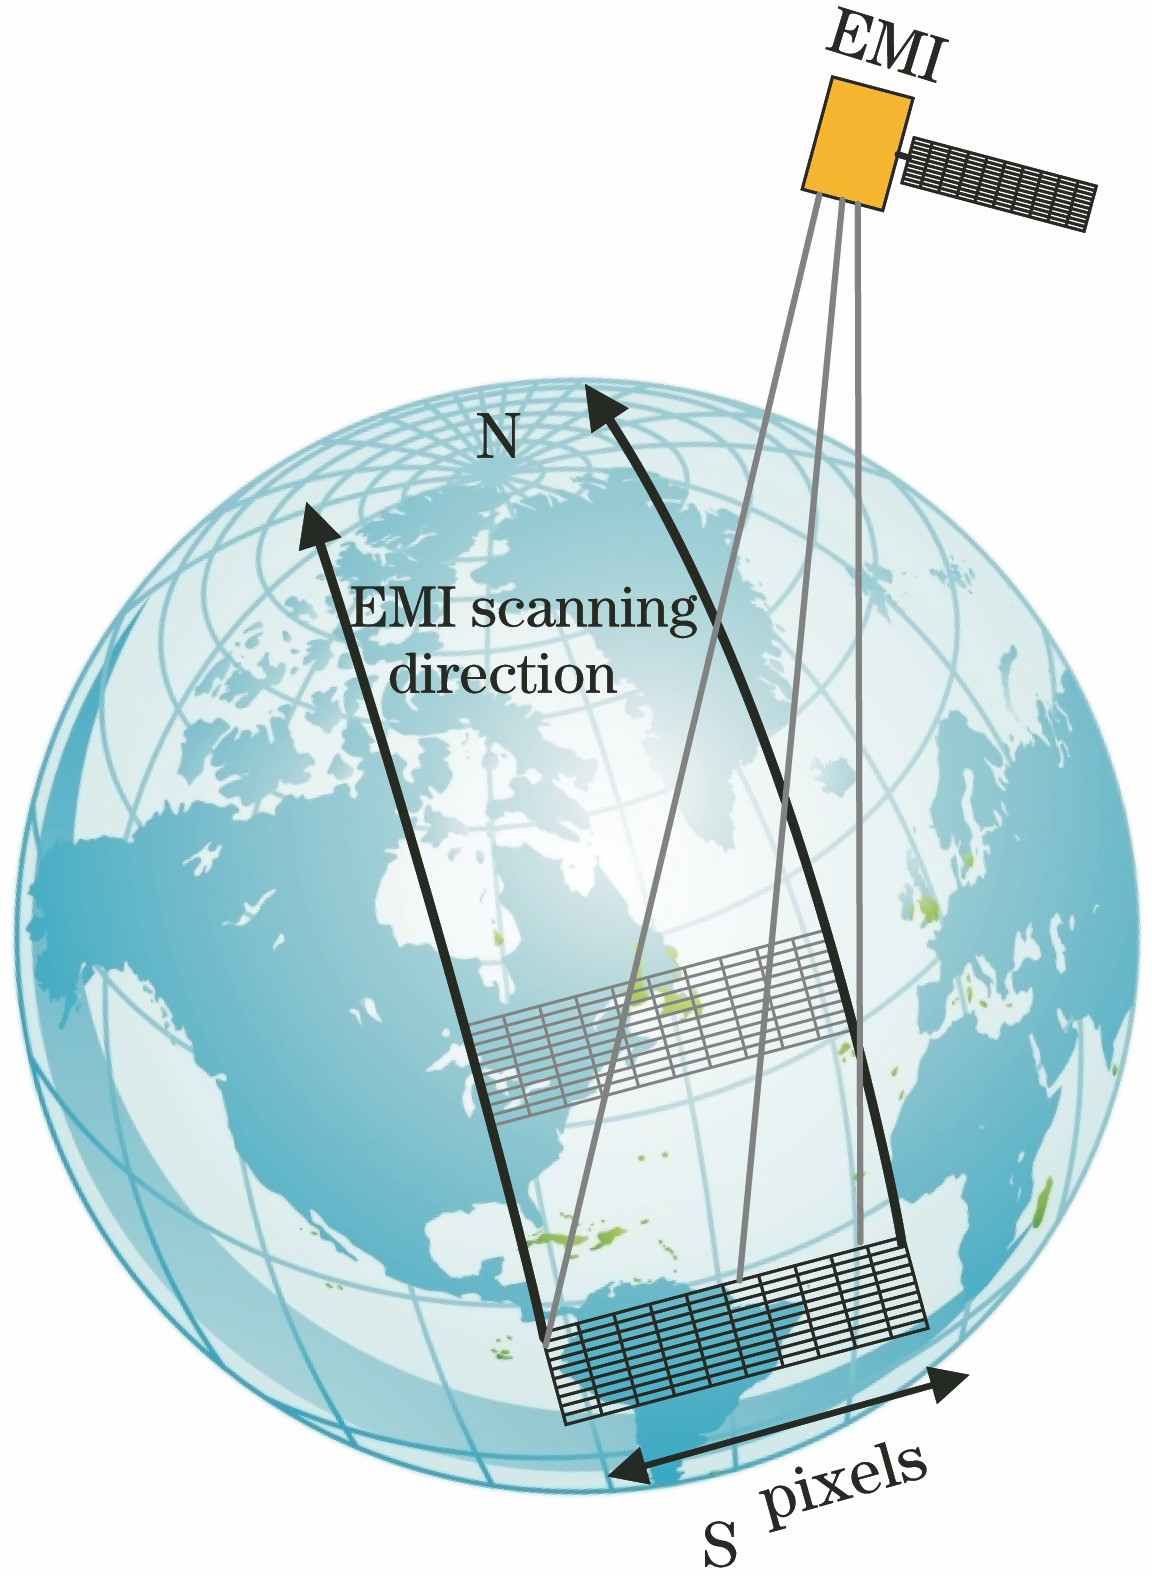
    Fig. 2. Push-broom diagram of EMI in a nadir
    Examples of O2-O2 DOAS fitting. (a) EMI measured spectrum(dashed line) and reference spectrum(solid line); (b) reference cross section (dashed line) and absorption cross section (solid line) of O2-O2; (c) reference cross section (dashed line) and absorption cross section (solid line) of Ring effect; (d) residual structure fitting
    Fig. 3. Examples of O2-O2 DOAS fitting. (a) EMI measured spectrum(dashed line) and reference spectrum(solid line); (b) reference cross section (dashed line) and absorption cross section (solid line) of O2-O2; (c) reference cross section (dashed line) and absorption cross section (solid line) of Ring effect; (d) residual structure fitting
    Diagram of independent pixel approximation model
    Fig. 4. Diagram of independent pixel approximation model
    EMI measured Ns,O2?O2 distribution
    Fig. 5. EMI measured Ns,O2?O2 distribution
    Difference between simulated and EMI measured O2-O2 VCD
    Fig. 6. Difference between simulated and EMI measured O2-O2 VCD
    Ns,O2?O2 distribution after correction
    Fig. 7. Ns,O2?O2 distribution after correction
    EMI measured distribution of cloud fraction
    Fig. 8. EMI measured distribution of cloud fraction
    OMI measured distribution of cloud fraction
    Fig. 9. OMI measured distribution of cloud fraction
    Frequency percent distribution of cloud fraction
    Fig. 10. Frequency percent distribution of cloud fraction
    Correlation analysis of OMI and EMI cloud fraction
    Fig. 11. Correlation analysis of OMI and EMI cloud fraction
    ParameterContent
    Temperature of NO2298 K, 220 K (Vandaele et al, 1996)[24]
    Temperature of O3293 K (Bogumil et al, 2003), 243 K (Bogumil et al, 2000)[25]
    Temperature of O2-O2293 K (Thalman et al, 2013)[26]
    Temperature of H2O297 K (hitran)[27]
    RingRing.exe
    Order of polynomial5
    OffsetConstant (0th order)
    Fitting interval460--490 nm
    Table 1. Parameter settings for O2-O2 DOAS fitting
    ParameterNode
    θSZA/(°)0.1, 7.2, 13.1, 23.1, 33.7, 44.4, 55.3, 65.9, 76.6, 87.1
    θVZA/(°)0.1, 7.2, 13.1, 23.1, 33.7, 44.4, 55.3, 65.9
    θRAA/(°)0, 30, 60, 90, 120, 150, 180
    Surface albedo0, 0.010, 0.025, 0.050, 0.075, 0.100, 0.150, 0.200, 0.250, 0.325, 0.400, 0.500, 0.600, 0.700, 0.800, 0.900, 1.000
    Surface or cloud pressure /hPa1013, 963, 913, 863, 813, 763, 713, 663, 613, 563, 513, 463, 413, 363, 313, 263, 213, 163, 113, 63
    Cloud fraction-0.100, -0.050, 0, 0.010, 0.020, 0.040, 0.060, 0.080, 0.100, 0.125, 0.150, 0.175, 0.200, 0.250, 0.300, 0.350, 0.400, 0.450, 0.500, 0.550, 0.600, 0.650, 0.700, 0.750, 0.800, 0.850, 0.950, 1.000, 1.100, 1.200
    Note: cloud fraction smaller than 0 and larger than 1 is included to enlarge the parameter space.
    Table 2. Input parameter node settings of radiative transfer model
    ParameterNode
    Rc at 468 nm0, 0.05, 0.10, 0.15, 0.20, 0.25, 0.30, 0.35, 0.40, 0.45, 0.50, 0.55, 0.60, 0.65, 0.70, 0.75, 0.80, 0.85, 0.90, 0.95, 1.00, 1.05, 1.10, 1.15, 1.20, 1.25, 1.50, 1.75, 2.00
    Ns,O2O2 /(1044 molecule2·cm-5)0, 0.05, 0.10, 0.15, 0.20, 0.25, 0.30, 0.35, 0.40, 0.45, 0.50, 0.55, 0.60, 0.65, 0.70, 0.75, 0.80, 0.85, 0.90, 0.95, 1.00, 1.10, 1.20
    Table 3. Node settings for Rcand Ns,
    Taiping Yang, Fuqi Si, Wang Ping, Yuhan Luo, Haijin Zhou, Minjie Zhao. Research on Cloud Fraction Inversion Algorithm of Environmental Trace Gas Monitoring Instrument[J]. Acta Optica Sinica, 2020, 40(9): 0901001
    Download Citation