• Spectroscopy and Spectral Analysis
  • Vol. 40, Issue 11, 3438 (2020)
Dan-dan KONG*, Tong-shuai HAN, Qing GE, Wen-liang CHEN, Rong LIU, Chen-xi LI, and Ke-xin XU
Author Affiliations
  • State Key Laboratory of Precision Measuring Technology and Instruments, Tianjin University, Tianjin 300072, China
  • show less
    DOI: 10.3964/j.issn.1000-0593(2020)11-3438-05 Cite this Article
    Dan-dan KONG, Tong-shuai HAN, Qing GE, Wen-liang CHEN, Rong LIU, Chen-xi LI, Ke-xin XU. Verification of Signal Extraction Capability of Near-Infrared Non-Invasive Blood Glucose Detection System[J]. Spectroscopy and Spectral Analysis, 2020, 40(11): 3438 Copy Citation Text show less
    Schematic diagram of optic fiber probe arrangement
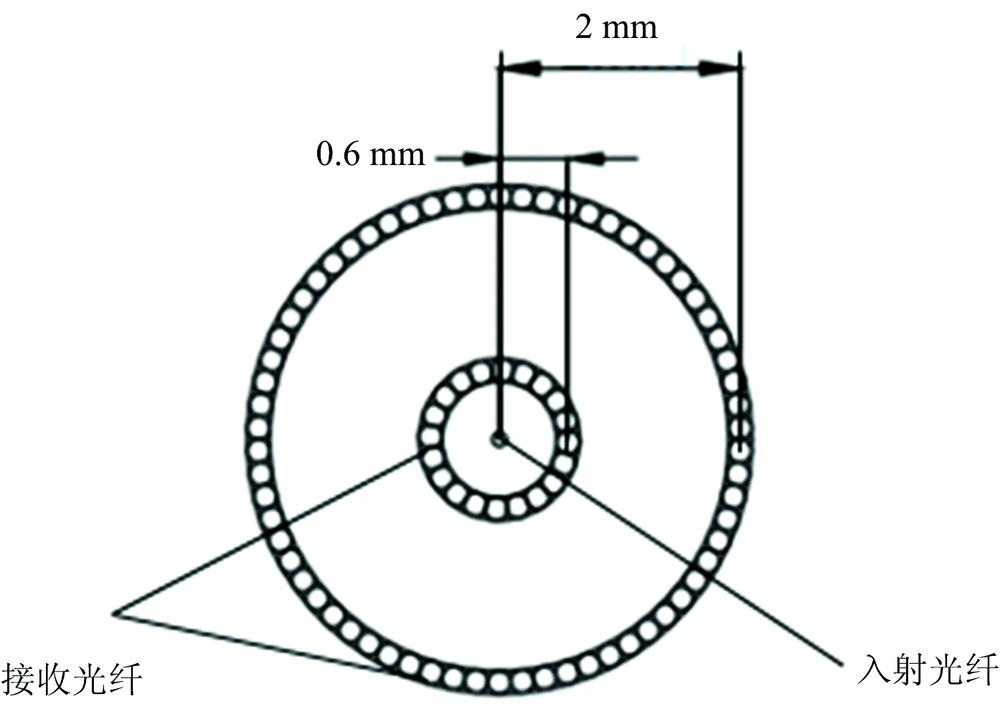
    Fig. 1. Schematic diagram of optic fiber probe arrangement
    Schematic diagram of non-invasive blood glucose detection system
    Fig. 1. Schematic diagram of non-invasive blood glucose detection system
    Average optical path length of the photon in the dermis (L) of the human forearm under the source-detector distance of the system
    Fig. 2. Average optical path length of the photon in the dermis (L) of the human forearm under the source-detector distance of the system
    The variance of absorbance change(a)subject 1(maximum change in blood glucose concentration: 5.4 mmol·L-1); (b)subject 2(maximum change in blood glucose concentration: 6.6 mmol·L-1); (c)subject 3(maximum change in blood glucose concentration: 5.5 mmol·L-1)
    Fig. 3. The variance of absorbance change(a)subject 1(maximum change in blood glucose concentration: 5.4 mmol·L-1); (b)subject 2(maximum change in blood glucose concentration: 6.6 mmol·L-1); (c)subject 3(maximum change in blood glucose concentration: 5.5 mmol·L-1)
    Variance of differential absorbance change (a) subject 1(maximum change in blood glucose concentration: 5.4 mmol·L-1); (b) subject 2 (maximum change in blood glucose concentration: 6.6 mmol·L-1); (c) subject 3(maximum change in blood glucose concentration: 5.5 mmol·L-1)
    Fig. 4. Variance of differential absorbance change (a) subject 1(maximum change in blood glucose concentration: 5.4 mmol·L-1); (b) subject 2 (maximum change in blood glucose concentration: 6.6 mmol·L-1); (c) subject 3(maximum change in blood glucose concentration: 5.5 mmol·L-1)
    波长/nm在体SNRΔcglim/(mg·dL-1)
    内环
    (0.6 mm)
    1 0507 1068.63
    1 2135 0169.91
    1 3144 4969.78
    1 4094 9907.27
    1 5506 2243.09
    1 6096 5802.35
    外环
    (2 mm)
    1 0505 5353.94
    1 2134 7893.78
    1 3144 7803.36
    1 4095 2322.34
    1 5506 0361.08
    1 6096 9430.79
    Table 1. The SNR and limit detection precision of system
    Dan-dan KONG, Tong-shuai HAN, Qing GE, Wen-liang CHEN, Rong LIU, Chen-xi LI, Ke-xin XU. Verification of Signal Extraction Capability of Near-Infrared Non-Invasive Blood Glucose Detection System[J]. Spectroscopy and Spectral Analysis, 2020, 40(11): 3438
    Download Citation