• Spectroscopy and Spectral Analysis
  • Vol. 41, Issue 7, 2269 (2021)
Jia LIU1、1;, Xue-jing SHEN1、1; 2;, Guan-zhen ZHANG3、3;, Fei-fei GUO2、2;, Dong-ling LI1、1; 2;, and Hai-zhou WANG1、1; *;
Author Affiliations
  • 11. Central Iron and Steel Research Institute, Beijing 100081, China
  • 22. NCS Testing Technology Corporation Limited, Beijing 100081, China
  • 33. Metals & Chemistry Research Institute, China of Railway Sciences Corporation Limited, Beijing 100081, China
  • show less
    DOI: 10.3964/j.issn.1000-0593(2021)07-2269-06 Cite this Article
    Jia LIU, Xue-jing SHEN, Guan-zhen ZHANG, Fei-fei GUO, Dong-ling LI, Hai-zhou WANG. Characterization of Original Position Statistical Distribution of Composition in Train Wheel Steel by Laser-Induced Breakdown Spectrum[J]. Spectroscopy and Spectral Analysis, 2021, 41(7): 2269 Copy Citation Text show less
    Schematic diagram of LIBSOPA system
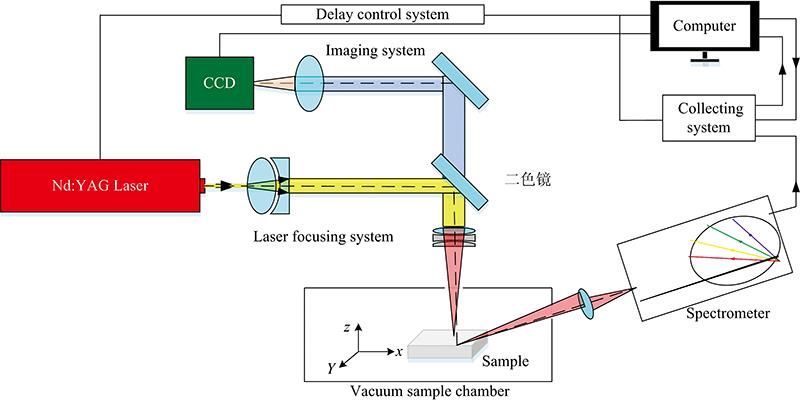
    Fig. 1. Schematic diagram of LIBSOPA system
    Schematic diagram of the sample(a): Schematic diagram of sample preparation; (b): Low times inspection sample; (c): LIBSOPA experimental sample
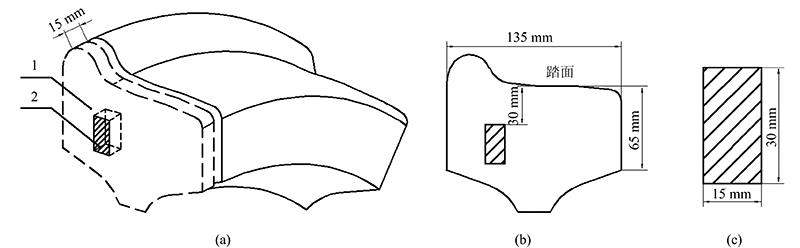
    Fig. 2. Schematic diagram of the sample
    (a): Schematic diagram of sample preparation; (b): Low times inspection sample; (c): LIBSOPA experimental sample
    The low-times inspection(a): Low times inspection drawing of rim section;(b): Local enlargment drawing of low times inspection
    Fig. 3. The low-times inspection
    (a): Low times inspection drawing of rim section;(b): Local enlargment drawing of low times inspection
    Relationship between different ablation pulses and spectral signal intensity
    Fig. 4. Relationship between different ablation pulses and spectral signal intensity
    Relationship between different ablation pulses and spectral signal stability
    Fig. 5. Relationship between different ablation pulses and spectral signal stability
    Calibration curve of elements
    Fig. 6. Calibration curve of elements
    Actual sample and scanning mode of wheel trerd
    Fig. 7. Actual sample and scanning mode of wheel trerd
    Two-dimensional component distribution map
    Fig. 8. Two-dimensional component distribution map
    Schematic diagram of statistical analysis of subregions
    Fig. 9. Schematic diagram of statistical analysis of subregions
    ElementReference Material/%
    SRM1761aSRM1762SRM1763SRM1765SRM1766SRM1767
    Si0.1820.350.630.0040.0010.026
    Mn0.67921.580.1440.0670.022
    P0.0420.0340.0120.005 20.0020.003 1
    S0.0370.030.0330.003 80.002 40.009
    Cr0.2220.920.50.0510.0240.001 5
    Ni1.9811.150.510.1540.0210.002
    Mo0.1030.350.50.0050.003 50.02
    Cu0.2980.120.0430.001 30.0150.001 4
    V0.0540.20.30.0040.0090.033
    Table 1. Reference material composition
    ElementResults of Spark source
    optical emission
    spectrum ω/%
    Results of
    LIBSOPA 200
    ω/%
    Si0.340.37
    Mn0.740.77
    P0.0070.006 5
    S0.0020.002 5
    Cr0.190.21
    Ni0.170.15
    Mo0.030.034
    Cu0.200.18
    V0.020.024
    Table 2. Quantitative results of LIBSOPA
    ElementStatistic segregation
    degree of A
    Statistic segregation
    degree of B
    Si0.047 20.056 3
    Mn0.039 50.053 6
    P0.20.248
    S0.580.731
    Cr0.043 90.057 8
    Ni0.023 70.029 5
    Mo0.1250.164
    Cu0.033 80.043 2
    V0.10.134
    Table 3. Statistic segregation degree
    Jia LIU, Xue-jing SHEN, Guan-zhen ZHANG, Fei-fei GUO, Dong-ling LI, Hai-zhou WANG. Characterization of Original Position Statistical Distribution of Composition in Train Wheel Steel by Laser-Induced Breakdown Spectrum[J]. Spectroscopy and Spectral Analysis, 2021, 41(7): 2269
    Download Citation