• Journal of Geographical Sciences
  • Vol. 30, Issue 9, 1401 (2020)
Bingfei HOU1、2, Chao JIANG1、2, and Osbert Jianxin SUN1、2、*
Author Affiliations
  • 1School of Ecology and Nature Conservation, Beijing Forestry University, Beijing 100083, China
  • 2Institute of Forestry and Climate Change Research, Beijing Forestry University, Beijing 100083, China
  • show less
    DOI: 10.1007/s11442-020-1789-5 Cite this Article
    Bingfei HOU, Chao JIANG, Osbert Jianxin SUN. Differential changes in precipitation and runoff discharge during 1958-2017 in the headwater region of Yellow River of China[J]. Journal of Geographical Sciences, 2020, 30(9): 1401 Copy Citation Text show less
    Map of the Yellow River headwater region (the grey relic map section) and the location of the Tangnaihai Hydrological Station (open triangle) for measuring runoff discharge of the region
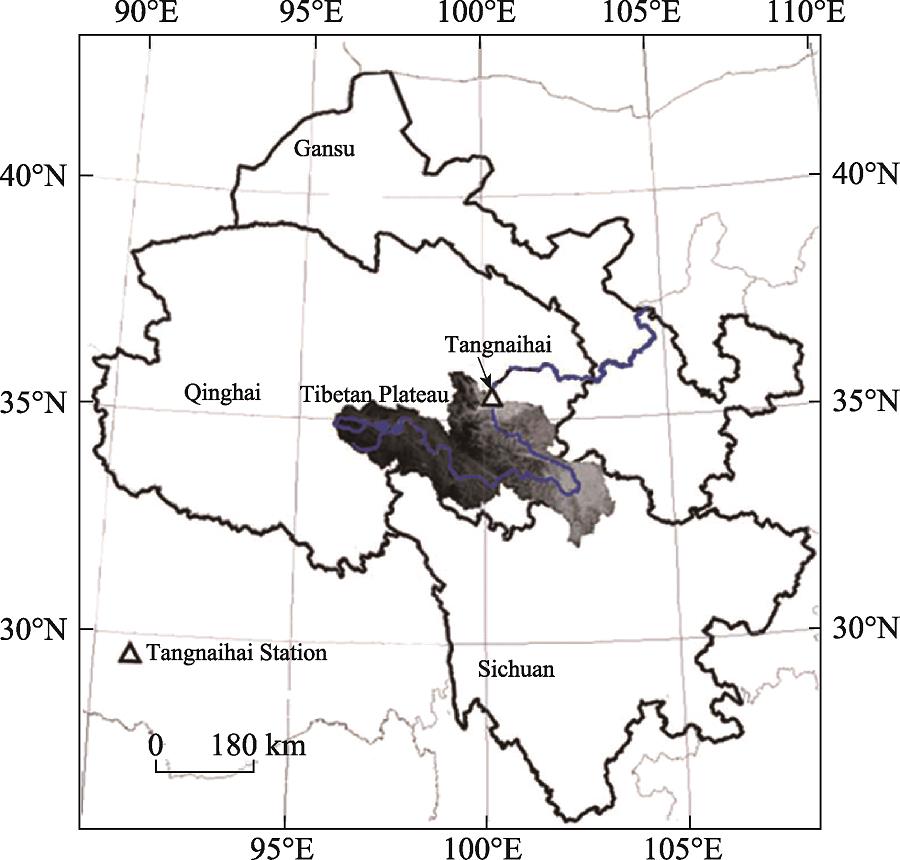
    Fig. 1. Map of the Yellow River headwater region (the grey relic map section) and the location of the Tangnaihai Hydrological Station (open triangle) for measuring runoff discharge of the region
    Comparisons of the decadal departure percentage of (a) temperature in the Yellow River headwater region, (b) evapotranspiration, (c) the runoff discharge at the Tangnaihai Hydrological Station of Qinghai province, China, and (d) precipitation in the Yellow River headwater region
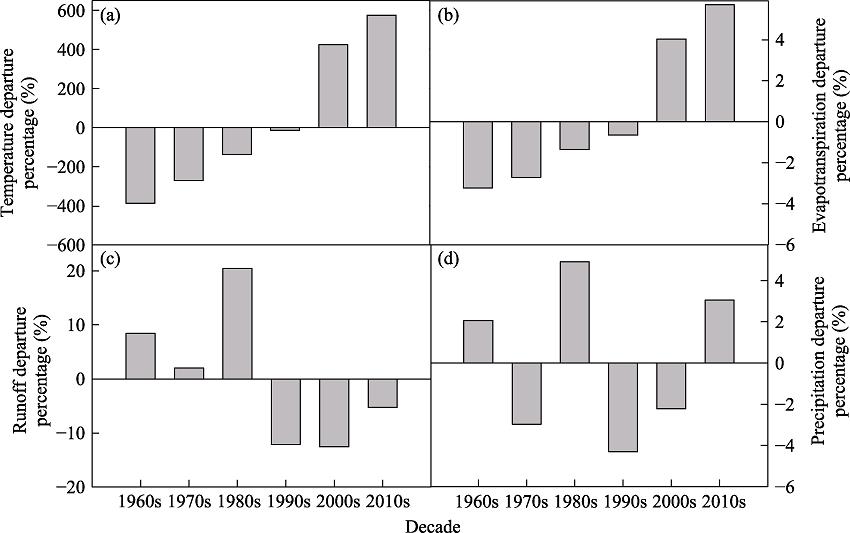
    Fig. 2. Comparisons of the decadal departure percentage of (a) temperature in the Yellow River headwater region, (b) evapotranspiration, (c) the runoff discharge at the Tangnaihai Hydrological Station of Qinghai province, China, and (d) precipitation in the Yellow River headwater region
    Interannual variations in runoff during 1958-2017 (solid line) and the 5-year moving average of available data (dash line) at the Tangnaihai Hydrologic Station of Qinghai province, China
    Fig. 3. Interannual variations in runoff during 1958-2017 (solid line) and the 5-year moving average of available data (dash line) at the Tangnaihai Hydrologic Station of Qinghai province, China
    Abrupt changes in average annual runoff discharge for the period 1958-2017 with Mann-Kendall test at the Tangnaihai Hydrological Station of Qinghai province, China. The two parallel horizontal dash lines show confidence range of P = 0.05. UFk (solid line) and UBk (long dash line) are forward and backward time series of the dimensionless variable u in the Mann-Kendall abrupt change detection, respectively.
    Fig. 4. Abrupt changes in average annual runoff discharge for the period 1958-2017 with Mann-Kendall test at the Tangnaihai Hydrological Station of Qinghai province, China. The two parallel horizontal dash lines show confidence range of P = 0.05. UFk (solid line) and UBk (long dash line) are forward and backward time series of the dimensionless variable u in the Mann-Kendall abrupt change detection, respectively.
    (a) Interannual variations in temperature during 1958-2017 (solid line) and evapotranspiration (dash line) in the Yellow River headwater region, (b) the Mann-Kendall abrupt change detection of temperature and (c) that of evapotranspiration, (b) and (c) show the 95% confidence range, and the UF (solid line) and UB (dash line) are forward and backward time series of the dimensionless variable u in the Mann-Kendall abrupt change detection, respectively.
    Fig. 5. (a) Interannual variations in temperature during 1958-2017 (solid line) and evapotranspiration (dash line) in the Yellow River headwater region, (b) the Mann-Kendall abrupt change detection of temperature and (c) that of evapotranspiration, (b) and (c) show the 95% confidence range, and the UF (solid line) and UB (dash line) are forward and backward time series of the dimensionless variable u in the Mann-Kendall abrupt change detection, respectively.
    (a) Interannual variations in precipitation during 1958-2017 (solid line) and the 5-year moving average of available data (dash line) in the Yellow River headwater region and (b) the Mann-Kendall abrupt change detection of precipitation. The two parallel horizontal lines in (b) show the 95% confidence range, and the UF (solid line) and UB (dash line) are forward and backward time series of the dimensionless variable u in the Mann-Kendall abrupt change detection, respectively.
    Fig. 6. (a) Interannual variations in precipitation during 1958-2017 (solid line) and the 5-year moving average of available data (dash line) in the Yellow River headwater region and (b) the Mann-Kendall abrupt change detection of precipitation. The two parallel horizontal lines in (b) show the 95% confidence range, and the UF (solid line) and UB (dash line) are forward and backward time series of the dimensionless variable u in the Mann-Kendall abrupt change detection, respectively.
    Projections of (a) monthly SPI12 time series in the Yellow River headwater region from 1958 to 2017, (b) the Mann-Kendall abrupt change detection of SPI12, and (c) the decadal departure of SPI12 from long-term average. The two parallel horizontal lines in (b) show the 95% confidence range, and the UF (solid line) and UB (dash line) are forward and backward time series of the dimensionless variable u in the Mann-Kendall abrupt change detection, respectively.
    Fig. 7. Projections of (a) monthly SPI12 time series in the Yellow River headwater region from 1958 to 2017, (b) the Mann-Kendall abrupt change detection of SPI12, and (c) the decadal departure of SPI12 from long-term average. The two parallel horizontal lines in (b) show the 95% confidence range, and the UF (solid line) and UB (dash line) are forward and backward time series of the dimensionless variable u in the Mann-Kendall abrupt change detection, respectively.
    Cyclic patterns of runoff discharge derived from Singular Spectrum Analysis at the Tangnaihai Hydrological Station of Qinghai province, China. (a) Reconstruction component 1 in runoff discharge derived from Singular Spectrum Analysis, showing the long-term for periods 1958-1988 (a1) and 1989-2017 (a2); (b) Reconstruction component 2 in runoff discharge derived from Singular Spectrum Analysis, showing a cyclic pattern of eight-year intervals for period 1958-1988 (b1) and a cyclic pattern of six-year intervals for period 1989-2017 (b2); (c) Reconstruction component 3 in runoff discharge derived from Singular Spectrum Analysis, showing a cyclic pattern of four-year intervals for period 1958-1988 (c1) and a cyclic pattern of three- to four-year interval for period 1989-2017 (c2).
    Fig. 8. Cyclic patterns of runoff discharge derived from Singular Spectrum Analysis at the Tangnaihai Hydrological Station of Qinghai province, China. (a) Reconstruction component 1 in runoff discharge derived from Singular Spectrum Analysis, showing the long-term for periods 1958-1988 (a1) and 1989-2017 (a2); (b) Reconstruction component 2 in runoff discharge derived from Singular Spectrum Analysis, showing a cyclic pattern of eight-year intervals for period 1958-1988 (b1) and a cyclic pattern of six-year intervals for period 1989-2017 (b2); (c) Reconstruction component 3 in runoff discharge derived from Singular Spectrum Analysis, showing a cyclic pattern of four-year intervals for period 1958-1988 (c1) and a cyclic pattern of three- to four-year interval for period 1989-2017 (c2).
    (a) Reconstruction component 1 in SPI12 derived from Singular Spectrum Analysis, for periods 1958-1988 (a1) and 1989-2017 (a2); (b) Reconstruction component 2 in SPI12 derived from Singular Spectrum Analysis, for periods 1958-1988 (b1) and 1989-2017 (b2) and (c) Reconstruction component 3 in SPI12 derived from Singular Spectrum Analysis for the period 1989-2017
    Fig. 9. (a) Reconstruction component 1 in SPI12 derived from Singular Spectrum Analysis, for periods 1958-1988 (a1) and 1989-2017 (a2); (b) Reconstruction component 2 in SPI12 derived from Singular Spectrum Analysis, for periods 1958-1988 (b1) and 1989-2017 (b2) and (c) Reconstruction component 3 in SPI12 derived from Singular Spectrum Analysis for the period 1989-2017
    Comparison between normalized annual average runoff discharge (solid line) and SPI12 (dotted line)
    Fig. 10. Comparison between normalized annual average runoff discharge (solid line) and SPI12 (dotted line)
    Bingfei HOU, Chao JIANG, Osbert Jianxin SUN. Differential changes in precipitation and runoff discharge during 1958-2017 in the headwater region of Yellow River of China[J]. Journal of Geographical Sciences, 2020, 30(9): 1401
    Download Citation