Abstract
Maintenance of steady streamflow is a critical attribute of the continental river systems for safeguarding downstream ecosystems and agricultural production. Global climate change imposes a potential risk to water supply from the headwater by changing the magnitude and frequency of precipitation and evapotranspiration in the region. To determine if and to what extent the recent climate changes affected streamflow in major river systems, we examined the pattern of temporal variations in precipitation, temperature, evapotranspiration and changes in runoff discharge during 1958-2017 in the headwater region of the Yellow River in northeastern Tibetan Plateau. We identified 1989 as the turning point for a statistically significant 14% reduction in streamflow discharge (P < 0.05) for the period 1989-2017 compared with 1958-1988, approximately coinciding with changes in the monthly distribution but not the interannual variations of precipitation, and detected a mismatch between precipitation and runoff after 2000. Both annual precipitation and runoff discharge displayed four- and eight-year cyclic patterns of changes for the period 1958-1988, and a six-year cyclic pattern of changes for the period 1989-2017, with two intensified two-year cyclic patterns in the changes of precipitation and a three-year cyclic pattern in the change of runoff further detected for the later period. Our results indicate that the temporal changes in runoff are not strictly consistent with the temporal variations of precipitation in the headwater region of Yellow River during the period 1958-2017. In particular, a full recovery in annual precipitation was not reflected in a full recovery in runoff toward the end of the study period. While a review of literature yielded no apparent evidence of raised evapotranspiration in the region due to recent warming, we draw attention to increased local retention of rainwater as a possible explanation of differential changes in precipitation and runoff.1 Introduction
The spatiotemporal patterns of climate change and its impact on regional hydrological processes are increasingly viewed as the focal issues in environmental studies (Barnett et al., 2008; Wanders et al., 2015; Arnell et al., 2016; Schwalm et al., 2017; Fowler et al., 2019; Li et al., 2019). Climate change imposes a potential risk to streamflow discharge from the headwater region either by changing the magnitude and frequency of precipitation, or by altering the timing and intensity of evapotranspiration and/or snow/ice melting, leading to unquantifiable consequences to the downstream ecosystems. Understanding changes in hydrological cycles under global climate change is key to devising adaptive management of natural resources in relation to water availability and usage in terrestrial ecosystems (Faroogi et al., 2020).
Over the past decades, marked changes in hydrological cycles have been observed in many of the large watersheds around the world in response to varying climate change factors. An earlier study by Milliman et al. (2008) shows that during 1951-2000, among 137 external-flow river systems worldwide, 48 were recorded with more than 30% reduction in runoff. Most of those 48 river systems occur between latitudes 10° and 35° in both the Northern and Southern Hemispheres, predominantly in arid and semiarid regions (Milliman et al., 2008). In the watershed of Colorado River in North America, there had been a 20% reduction in streamflow since 2000 compared with the long-term mean since 1896, likely resulting from both rising global temperatures and reduced regional precipitation (Bradley et al., 2006; Udall and Overpeck, 2016). The Rio Grande river basin between USA and Mexico had experienced dry and warmer climates in recent decades, giving rise to reduced streamflow (Elias et al., 2015; Woodhouse et al., 2016; Lehner et al., 2017). Long-term streamflow data from 15 watersheds in the north of the Pyrenees Mountains of Southern France revealed a 20% reduction in streamflow discharge due to greatly intensified warming under the influence of subtropical high pressure (Lespinas et al., 2010). In Southeast Australia, the “millennium drought” from the end of the 20th century to the early 21st century resulted in 48% reduction in the regional runoff, coinciding to only 13% decreases in precipitation over the corresponding period (Petheram et al., 2011; Chiew et al., 2014; Saft et al., 2014; Van Loon et al., 2015; Yang et al., 2017). Apart from the direct climatic influences, there have been research findings of the effects on streamflow by other factors. For example, in studies of 47 medium- and small-sized rivers under moist climate in Austria, Haslinger et al. (2014) found that with increasing drought conditions, the role of groundwater in affecting streamflow became more prominent while the influences of climatic signals weakened. Similarly, in the Red River watershed in western Oklahoma and the southern High Plains in Texas, USA, groundwater use was found to be one of the main drivers in annual streamflow variability during drought (Krueger et al., 2017). Warming-induced ice-melting has been found to increase streamflow in regions with glaciers, independent of the effects by precipitation (Bury et al., 2011; Marazi and Romshoo, 2018). The abovementioned case studies show the varying impacts by climatic factors and other drivers on river streamflow among regions and the occurrence of changing regional climate-hydrodynamics relationships.
The Yellow River in China is the third longest river in Asia, running across nine provinces from its origin in northeastern Tibetan Plateau to its outlet in Shandong province with a total length of 5464 km and a total drainage area of about 752,546 km2. It is known as the origin of ancient Chinese civilization and its streamflow has continuously served as critical water sources to support agricultural production and ecosystem functionality along the waterway. The Tibetan Plateau is amongst the world’s most susceptible regions to global warming (Immerzeel et al., 2010; Ran et al., 2018; Thompson et al., 2018). The headwater region of Yellow River in northeastern Tibetan Plateau is situated in an intersection between the monsoonal and non-monsoonal climates, with alternate influences of the East Asian monsoon, the southern subtropical monsoon, and the plateau monsoon, hence a region not only susceptible to climate change but also ubiquitous in climatic influences. Because of the socio-economic and ecological significance of the Yellow River and the complex climatic system in its headwater region, a clear understanding on the climate-streamflow relationship in the Yellow River drainage area is crucial for developing regional adaptive socioeconomic structures and natural resources management strategies as governance measures coping with intensifying global climate change.
Over the past decades, there were observations of markedly reduced streamflow discharge in the headwater region of Yellow River without apparent trends in annual precipitation. Previous researches show that the regional air temperatures displayed a trend of apparent increases since the 1970s, but annual precipitation only slightly decreased after the 1990s (Zhao et al., 2007; Zhang et al., 2011); whilst the streamflow experienced an abrupt reduction (Zhou et al., 2012). Explanations for the variable streamflow discharges in the headwater of Yellow River are controversial, varying from changes in precipitation (e.g. Li et al., 2012; Cuo et al., 2013; Tang et al., 2013; Tian et al., 2015; Meng et al., 2016) to temperature-induced alteration in evapotranspiration (e.g. Zhang et al., 2011; Meng et al., 2016). Snow-melting, human activities, glacier-retreat and permafrost degradation are also considered to play some roles in influencing the regional hydrological processes (Zhao et al., 2009; Li et al., 2012; Wu et al., 2018). The study of Xu (2015) suggests that under climate change, the effects of precipitation and temperature on runoff and their relationships with streamflow are all altered, and that changes in climate and changes in streamflow are not necessarily synchronized. Given the uncertainties in the causes of reduced streamflow discharge in the headwater region of Yellow River, we examined the long-term trend and cyclic changes in the regional climate and streamflow. Our objectives were to determine, in the headwater region of Yellow River: (1) the trend of climate change and its effect on streamflow discharge; and (2) the interrelationship between climate change and variations in streamflow.
2 Materials and methods
2.1 Study area
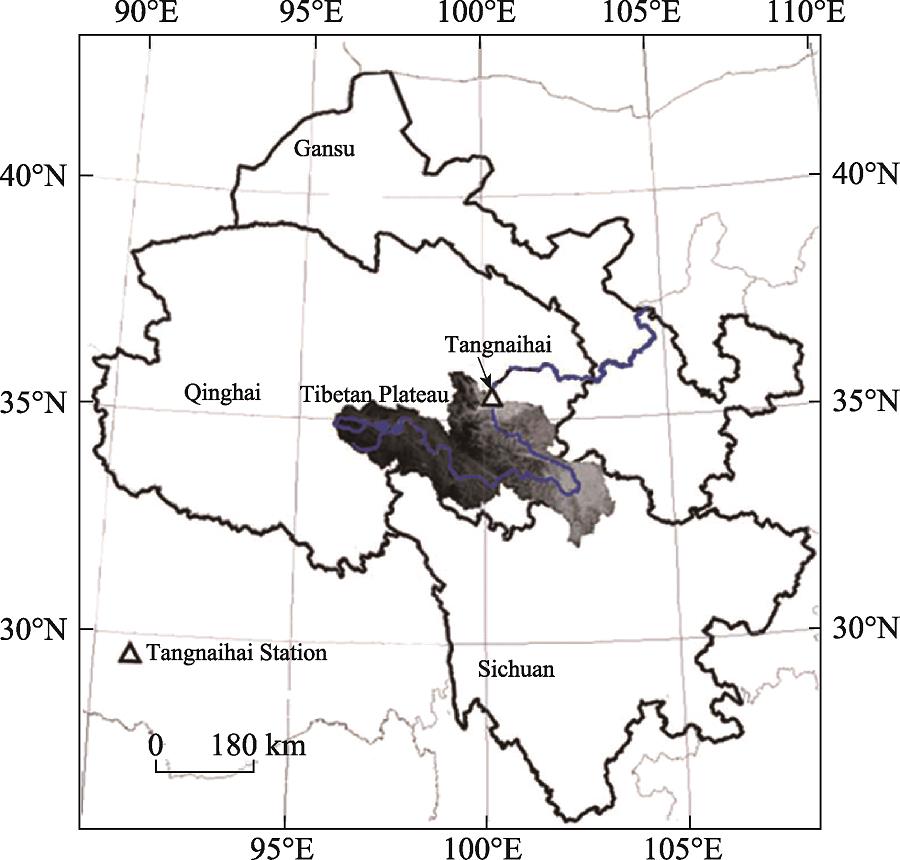
This study covers the entire Source Region of Yellow River (SRYR), located in the upper basin of the Tangnaihai Hydrological Station (Figure 1), mostly in the territory of the three rivers (i.e. Yangtze River, Yellow River, and Lancang-Mekong River) National Nature Reserve (32°30′N-36°10′N, and 95°50′E-103°30′E). SRYR is on the northeast of Tibetan Plateau and covers an area of 121,972 km2, with predominantly plateau continental climate influenced alternately by the East Asian monsoon, the southern subtropical monsoon, and the plateau monsoon (Ding, 2013). The altitude of the region varies between 2675 m and 6282 m above sea level. The annual mean temperature varies between -3.0 and 1.8℃, and the annual precipitation from 420.8 to 743.3 mm. The main waterway of Yellow River in this region is approximately 1959 km, with mean annual runoff of 202.35×10⁹ m3. Permanent and seasonal permafrost are distributed in the region. Despite the high altitude, 99% of the area is below the snow line, so there is little glacier distribution in the basin.

Figure 1.
Map of the Yellow River headwater region (the grey relic map section) and the location of the Tangnaihai Hydrological Station (open triangle) for measuring runoff discharge of the region2.2 Meteorological data
The monthly data of air temperatures and precipitation for the study region during 1958-2017 were derived from the Geographic Information System-based LZU0025 dataset, compiled by the Key Laboratory of Western China’s Environmental Systems of the Ministry of Education, Lanzhou University (Wu et al., 2014). The dataset was developed based on meteorological observations for 753 National Meteorological Stations of China nationwide. The grid maps of climatic layers were at 0.025º´0.025º spatial resolution intersected using the ANUSPLIN software (Fenner School of Environment and Society, Australian National University). The monthly evapotranspiration was calculated from monthly temperature by the method of Thornthwaite, as described in Chang (1989).
2.3 Hydrological data
Runoff from the SRYR is typically discharged into the main stream of the Yellow River through the Tangnaihai Hydrological Station (35º30’N, 100º09’E), accounting for approximately one third of the River’s water supply. We therefore used the hydrological data for this station to analyze the variations of streamflow discharge to the Yellow River. The runoff data at the Tangnaihai Hydrological Station were initially obtained from the Annual Hydrological Report (HBCMWR, 1958-1988, 2009-2017) and the Yellow River Water Resources Bulletins (Anonymous, 1989-2008) and subjected to quality check for consistency and abnormality. Due to historical interruptions in data collections and uncertainties in some of the data records, we finally used the monthly runoff data for the periods 1958-1988 and 2009-2017 and the annual runoff data for the period 1989-2008 in this study.
2.4 Statistical analyses
We used the non-parametric Mann-Kendall (M-K) test to detect significant trends and breaks in the hydroclimatic time series for 1958-2017, as recommended by World Meteorological Organization (WMO, 2000). Our analyses followed the method and procedures described in Zhang et al. (2012), Chen et al. (2013) and Ghaleni et al. (2015), and the change point was determined as the cross-point of a forward sequence curve (UF) and a backward sequence curve (UB) derived from values of statistics UFk and UBk (see Ghaleni et al., 2015 for definition and computations).
The moving t-test (MTT) approach was used to test the difference between two sub-series before and after the climate jump (shift) point, following the method of Maidment (1993).
The hydrological effect of precipitation was assessed with Standardized Precipitation Index (SPI), following the method McKee et al. (1993, 1995). The values of SPI were computed by dividing the difference between normalized seasonal rainfall and its long-term seasonal mean by the standard deviation to measure rainfall shortage as:
$\text{SPI}=\frac{{{X}_{ij}}-{{X}_{lm}}}{\sigma }$
where xij is the seasonal rainfall at the ith rain gauge station and the jth observation, Xlm the long-term mean of seasonal rainfall, and σ the standard deviation of Xlm.
As the long-term and runoff droughts are represented by the SPI at the time scale greater than six months (McKee et al., 1993, 1995), in this study, the Pearson correlation coefficients of SPI based on time scales of 6 to 48 months with standardized runoff levels were calculated to determine the appropriate time scale. According to the correlation analysis, the time scales of 12 to 18 months yielded the highest correlation coefficients (r > 0.82). In order to balance the data correlation and quality, we opted for the SPI time scale of 12 months (SPI12) to measure the level of hydrological extreme event.
To investigate the relationships between precipitation and runoff, we performed Singular Spectrum Analysis (SSA) between the monthly SPI12 time series and the annual runoff time series from 1958 to 2012, following Vautard et al. (1992) and Elsner and Tsonis (1997).
We also examined the individual effects of temperature on runoff based on the method of Thornthwaite (1948).
3 Results
3.1 Decadal variations in runoff and impact factors
The decadal temperature and evapotranspiration in the headwater region of Yellow River showed continuous and marked increases from the 1960s to the 2010s (Figures 2a and 2b). The runoff and precipitation maintained a high correlation until 2000, and then the patterns differentiated thereafter. The runoff discharge showed only some degree of recovery in the 2010s (Figure 2c), despite a clear pattern of recovery in precipitation following the initial phase of decline to exceed the long-term average in the 2010s (Figure 2d).
Figure 2.
Comparisons of the decadal departure percentage of (a) temperature in the Yellow River headwater region, (b) evapotranspiration, (c) the runoff discharge at the Tangnaihai Hydrological Station of Qinghai province, China, and (d) precipitation in the Yellow River headwater region3.2 Interannual variations in runoff discharge
The average runoff discharge from the headwater region of Yellow River reached 20.24 billion m3 per annum and varied markedly interannually (with a CV of 0.26; Figure 3) over the period 1958-2017. While overall the runoff discharge displayed a downward trend at a decadal reduction rate of 2.36%, there were four distinct patterns of temporal changes: a significant increase from the late 1950s to late 1980s with an average of 21.7 billion m3 per annum and a historical maximum of 32.8 billion m3 for 1989; a sharp decline from the 1990s to the 2000s with an average of 16.5 billion m3 per annum and a historical minimum of 16.5 billion m3 for 2002; a pattern of interannual fluctuation and slight recovery from the 2000s to the beginning of the 2010s with an average of 20.2 billion m3 per annum; and finally a decline in the last 5 years with an average of 16.7 billion m3 per annum. There was a significant increase in the annual runoff from 1958 to 1988, at an average rate of 0.15 billion m3 per annum (P < 0.05); whilst only a slight decrease occurred at a rate of -0.02 billion m3 per annum over the period from 1989 to 2017. The M-K tests revealed the occurrence of an abrupt change in 1989 as inferred by the crossing between the UFk and UBk signals, clearly differentiating between a pattern of significant increase prior to the point and a pattern of significant decline thereafter until 2017 (Figure 4); there was a significant difference (P < 0.05) in the mean annual runoff discharge between the two sub-periods.
Figure 3.
Interannual variations in runoff during 1958-2017 (solid line) and the 5-year moving average of available data (dash line) at the Tangnaihai Hydrologic Station of Qinghai province, China
Figure 4.
Abrupt changes in average annual runoff discharge for the period 1958-2017 with Mann-Kendall test at the Tangnaihai Hydrological Station of Qinghai province, China. The two parallel horizontal dash lines show confidence range of <italic>P</italic> = 0.05. UF<sub>k</sub> (solid line) and UB<sub>k</sub> (long dash line) are forward and backward time series of the dimensionless variable u in the Mann-Kendall abrupt change detection, respectively.3.3 Interannual variations in impact factors
Annual mean temperature and evapotranspiration in the headwater region of Yellow River showed a trend of continuous rises (Figure 5a). During the past 60 years, the average annual temperature rose by nearly 2℃. Evapotranspiration increased from an average of 500 mm in the 1960s to 547 mm in the 2010s correspondingly. The M-K tests revealed that the temperature experienced a significant rise (P < 0.05) in 1988 and then an abrupt change in 1997 as indicated by an intersection of the UFk and UBk (Figure 5b). Moreover, the UF statistics inferred a pattern of continuous increases in evapotranspiration until it exceeded the 0.05 significance level and then the points of abrupt change during 2002-2003 (Figure 5c). However, as the abrupt change points of temperature and evapotranspiration were not in the effective region, there are some degrees of uncertainty in the timing of abrupt changes. Figure 6a shows the variations of mean annual precipitation durng 1958-2017. The M-K test of precipitation indicated that there were neither significant changes in precipitation nor climatic jumps except a trend similar to that of runoff (Figure 6b). The Pearson correlation coefficient reduced from 0.82 (P < 0.05) before 1989 to 0.78 (P < 0.05) thereafter. We found no evidence of consistent patterns of variations of runoff with temperature, evapotranspiration, and precipitation.
Figure 5.
(a) Interannual variations in temperature during 1958-2017 (solid line) and evapotranspiration (dash line) in the Yellow River headwater region, (b) the Mann-Kendall abrupt change detection of temperature and (c) that of evapotranspiration, (b) and (c) show the 95% confidence range, and the UF (solid line) and UB (dash line) are forward and backward time series of the dimensionless variable u in the Mann-Kendall abrupt change detection, respectively.
Figure 6.
(a) Interannual variations in precipitation during 1958-2017 (solid line) and the 5-year moving average of available data (dash line) in the Yellow River headwater region and (b) the Mann-Kendall abrupt change detection of precipitation. The two parallel horizontal lines in (b) show the 95% confidence range, and the UF (solid line) and UB (dash line) are forward and backward time series of the dimensionless variable u in the Mann-Kendall abrupt change detection, respectively.3.4 Variations in Standardized Precipitation Index (SPI)
Highly significant correlations were found between SPI for the 12-month-duration (SPI12) and annual runoff discharge (r > 0.82, P < 0.001; Figure 7a). The M-K tests revealed three points of abrupt changes in SPI12, i.e. 1969, 1977, and 1987 (Figure 7b). However, the moving t-test identified the first two points as false (Figure 7c). The UF statistics indicated a pattern of increase in SPI12 in the 1960s, followed by a period of fluctuation in the 1970s and then a sharp decline and recovery after 1987 (Figure 7b). The patterns of changes in SPI12 were consistent with that of runoff discharge. The decadal analysis of SPI12 indicated that the effect of precipitation on runoff discharge started to recover after 2000 and exceeded the normal level in the 2010s (Figure 7d). The trends of changes were very similar between SPI12 and precipitation (Figure 6a; Figure 7a), but the patterns differed. For instance, M-K test detected a change point of SPI12 in 1987 and a significant reduction in 2002; whilst none of these were shown in precipitation (Figures 6b and 7b).
Figure 7.
Projections of (a) monthly SPI12 time series in the Yellow River headwater region from 1958 to 2017, (b) the Mann-Kendall abrupt change detection of SPI12, and (c) the decadal departure of SPI12 from long-term average. The two parallel horizontal lines in (b) show the 95% confidence range, and the UF (solid line) and UB (dash line) are forward and backward time series of the dimensionless variable u in the Mann-Kendall abrupt change detection, respectively.3.5 Cyclic patterns of runoff discharge, impact factors and SPI12
During 1958-1988, the runoff discharge displayed an increasing trend (Figure 8a1) and two cyclic patterns, including a cyclic pattern of eight-year intervals (Figure 8b1) and a cyclic pattern of four-year intervals (Figure 8c1). RC1 explained 95% of the variations in the changes of runoff discharge. After discounting RC1, the cyclic pattern of eight-year intervals (RC2) explained 42.0% of the variations and that of four-year intervals (RC3) explained 27.5% of the variations, respectively. The cyclic pattern of eight-year intervals peaked in 1960, 1967, 1975, and 1983, with increasing signals;whilst the cyclic patterns of four-year intervals peaked in 1959, 1963, 1967, 1971, 1975, 1979, 1983, and 1987, with weakening signals. The peaks and valleys of the eight-year cyclic pattern coincided with those of the four-year cyclic pattern (Figures 10b1 and 10c1). The coincidence of the peaks between the two cyclic patterns was associated with the peak values of runoff discharge (Figures 2 and 8).
Figure 8.
Cyclic patterns of runoff discharge derived from Singular Spectrum Analysis at the Tangnaihai Hydrological Station of Qinghai province, China. (a) Reconstruction component 1 in runoff discharge derived from Singular Spectrum Analysis, showing the long-term for periods 1958-1988 (a1) and 1989-2017 (a2); (b) Reconstruction component 2 in runoff discharge derived from Singular Spectrum Analysis, showing a cyclic pattern of eight-year intervals for period 1958-1988 (b1) and a cyclic pattern of six-year intervals for period 1989-2017 (b2); (c) Reconstruction component 3 in runoff discharge derived from Singular Spectrum Analysis, showing a cyclic pattern of four-year intervals for period 1958-1988 (c1) and a cyclic pattern of three- to four-year interval for period 1989-2017 (c2).During 1989-2017, the runoff experienced an initial decline before a steady recovery (Figure 8a2). The runoff displayed a cyclic pattern of approximately six-year intervals (Figure 8b2) and about three-year intervals (Figure 8c2) during 1989-2017. Six-year intervals, with peaks occurring in 1993, 1999, 2005 and 2012, corresponded to the peak values of runoff discharge. These cyclic patterns explained 31% and 12% of the variations in runoff discharge after discounting the explanations of RC1 (94%), respectively.
During 1958-1988 and 1989-2017, both temperature and evapotranspiration showed continuous increasing trends. There were only two cyclic patterns of 12-month intervals and 6-month intervals in the temperature time series (explaining 95% and 1.4% of the variations, respectively) and no cyclic pattern detected in evapotranspiration series. Similar to temperature, only 12-month intervals and 6-months intervals were detected in precipitation. The SPI12 displayed a cyclic pattern of approximately four-year intervals (Figure 9a1) and eight-year intervals (Figure 9b1) during 1958-1988, roughly matching the patterns of runoff discharge. The cyclic pattern of four-year intervals explained 25.8% of the variations in SPI12, and that of eight-year intervals explained 20.7%, respectively. Three cyclic patterns of SPI12 were also detected for the period 1989-2017: one for six-year intervals (Figure 9a2), one for two-year intervals with maximum of variation in 2010 (Figure 9b2), and the other for two-year intervals (Figure 9c) characterized by increasing amplification with time, explaining 26.1%, 11.4% and 10.4% of the variations, respectively.
The patterns of normalized annual average runoff and SPI12 were generally well matched during 1958-1988, but became slightly departed from each other during 1989-2017, especially after 2000 (Figure 10).
Figure 9.
(a) Reconstruction component 1 in SPI12 derived from Singular Spectrum Analysis, for periods 1958-1988 (a1) and 1989-2017 (a2); (b) Reconstruction component 2 in SPI12 derived from Singular Spectrum Analysis, for periods 1958-1988 (b1) and 1989-2017 (b2) and (c) Reconstruction component 3 in SPI12 derived from Singular Spectrum Analysis for the period 1989-2017
Figure 10.
Comparison between normalized annual average runoff discharge (solid line) and SPI12 (dotted line)4 Discussion
Our results show that the headwater region of Yellow River in China experienced a marked decline in the annual runoff discharge during 1958-2017, and there existed a point of abrupt change in 1989. The same abrupt change point was previously reported for a greater region of the upper reach of Yellow River by Zhao et al. (2015). Comparing among interannual variations in precipitation, temperature, evapotranspiration, runoff and SPI12, we found unsynchronized patterns between precipitation and runoff discharge in the headwater region of Yellow River with the continuous increase of temperature and evapotranspiration in the 21st century, i.e. the recovery of annual precipitation was not accompanied by a recovery in annual runoff discharge. Examinations of SPI12 and runoff with Singular Spectrum Analysis indicate an intensifying pattern of a two-year cycles in precipitation following the occurrence of the abrupt changing point in 1989; this pattern was not detected in runoff. A simulation study by Li et al. (2012) suggested that a decline in precipitation, especially in the summer season, is a primary driver of decreasing runoff in the upper reach of Yellow River, while temperature rises may play a secondary role. Iqbal et al. (2018) mentioned that the short drought significantly increased (periods without rain for ≤ 10 d) in SRYR, which might result in low soil moisture and hinder the runoff process. Lan et al. (2010) also attributed the changes in runoff in the headwater region of Yellow River more to the influence of precipitation than temperature. Results from our current study appear to be in agreement with previous findings for the period prior to 2000. After 2000, the annual runoff discharge in the headwater region of Yellow River maintained a declined level relative to the period 1958-1988 despite a recovery in precipitation, ruling out the direct influence of precipitation on runoff. This might be affected by continuously increasing of temperature and evapotranspiration. This was further supported by our findings of the occurrence of two-year cyclic change in precipitation but about three-year cyclic change in runoff discharge for the period 1989-2017. By examining the data for the period 2000-2011, Tian et al. (2015) drew the conclusion of a recovery in runoff with precipitation. However, by comparing with the overall pattern during 1958-2017, we found markedly reduced runoff for the period 2000-2011 despite the recovery of precipitation to almost the long-term norm. The runoff departure percentage also point to a lag of recovery in runoff after the abrupt changing point in 1989 (see Figure 4).
The headwater region of Yellow River experienced a 14.0% decline in runoff with only 1.3% drop in precipitation since the late 1980s. This large discrepancy in the magnitude of changes between the two variables signifies the complex precipitation-runoff relationships. The study of Chiew et al. (2006) shows that under water limiting conditions, a decline in precipitation is likely to result in two- to three-folds of decline in runoff. In our study, the imbalance between the decline in runoff and that of precipitation is more than ten-folds.
The watershed hydrological processes can be influenced by both environmental factors such as precipitation, temperature, wind velocity, and the timing of precipitation, and watershed attributes such as land cover/land use, soil properties, groundwater level, and snow cover (Parry et al., 2012; Saft et al., 2014; Manning et al., 2018). When other factors remain relatively constant, such as in undisturbed watersheds, precipitation is the primary driver in changes in runoff. In our study, recent changes in precipitation in the headwater region of Yellow River clearly does not fully account for the marked decline in runoff, suggesting the likely influences of other factors. The lack of a close coupling between precipitation and runoff has been seen an increasing phenomenon globally. In assessing the impact of “millennium-drought” in Australia, it was found that decreasing precipitation explained only a fraction of the decline in runoff (Kiem and Verdon-Kidd, 2010; Potter and Chiew, 2011; Chiew et al., 2014). In the upper reach of Colorado River basin in USA, while historically precipitation was the primary driver of changes in runoff (Udall and Overpec, 2016), the close coupling of the precipitation-runoff relationship became weaker during recent drought events (Lehner et al., 2017). Apart from the direct impact of precipitation, factors associated with climate warming have been recognized to play a role in affecting runoff (Barnett et al., 2008; Bonfils et al., 2008; Elias et al., 2015; Woodhouse et al., 2016).
In the headwater region of Yellow River, temperature has been considered an important factor next to precipitation in affecting runoff (Li et al., 2012). Our data shows the temperature and evapotranspiration can well explain the interdecadal variation of runoff, especially after 2000. However, these two factors did not reveal any consistency to the interannual change features of runoff. In fact, the actual mechanism is unclear and controversial views are found in literature (e.g. Zhao et al., 2007; Zhang et al., 2011; Li et al., 2012; Ma et al., 2012; Li et al., 2013; Tian et al., 2015). One of the likely effects of temperature on hydrological processes is by controlling evapotranspiration. However, factors affecting evapotranspiration are complex (Roderick and Farquhar 2004; Lockart et al., 2009; McVicar et al., 2012). Previous studies show either reduced evapotranspiration or lack of significant changes depending on the data period for the greater Qinghai-Tibet Plateau (Liu et al., 2010; Wang et al., 2013). The differentiated results we obtained may be attributed to the different methods of evapotranspiration estimation. The headwater region of Yellow River is situated on the Qinghai-Tibet Plateau, where the occurrence of permafrost is widespread and a prominent feature of the landscape. Several recent studies show continued decreases in the thickness of permafrost layer (Li et al., 2016; Qin et al., 2017; Luo et al., 2018; Ran et al., 2018). This could result in increased local drainage of runoff and soil water loss through evapotranspiration, thereby reducing the downstream runoff discharge. Interactions between surface runoff and groundwater are also likely to complicate the precipitation-runoff relationship (Hughes et al., 2012; Van Lanen et al., 2013; Van Loon et al., 2017). The groundwater system can buffer the propagation of meteorological drought to streamflow by sustaining streamflow during short dry periods and isolated dry years. If the groundwater is severely depleted after a prolonged dry period, e.g. at decadal scale, the priority in recharging groundwater when precipitation is recovered to the long-term norm may lead to a delayed response of runoff to precipitation (Brunner et al., 2009; Petrone et al., 2010; Hughes et al., 2012).
The headwater region of Yellow River of China was located in the Three-Rivers National Nature Reserve. The human activities of the study area were limited (Cuo et al., 2013), and the land use change mainly occurred before 2000 (Chen et al., 2020). During 1986-2015, the grassland and woodland areas decreased slightly by 1.25% and 1.12%, respectively (Chen et al., 2020); whereas the vegetation index increased by 64% during 2000-2011 (Liu et al., 2013). An improvement in the regional vegetation may lead to an increase in evapotranspiration, which might exacerbate the mismatch between runoff and precipitation.
Our results show changed climate-hydrodynamics relationship in the headwater region of Yellow River. We found differential temporal patterns of changes in precipitation and runoff discharge and lack of a full recovery in runoff when precipitation reached normal toward the end of study period. The rising evapotranspiration caused by the continuous increase of temperature is mainly reflected in the interdecadal variation, especially in the 21st century. However, the interannual change of runoff might be due to changes in precipitation represented by SPI12. We draw attention on possible effects of increased local drainage and retention of rainwater due to warming-induced permafrost degradation and soil water loss during periods of severe drought on climate-hydrodynamics relationships.
5 Conclusions
The average runoff discharge from the headwater region of Yellow River displayed a downward trend over the period 1958-2017. In particular, a sharp decline occurred from the 1990s to 2000s. An abrupt change point in 1989 was detected, clearly differentiating between a pattern of significant increase prior to the point and a pattern of significant decline thereafter until 2017. During 1958-1988, the runoff discharge displayed four- and eight-year cyclic patterns of changes, whilst six- and three-year cyclic patterns of changes occurred for the period 1989-2017.
We found no significant changes in either the variations of mean annual precipitation or climatic jumps during 1958-2017. There was clearly a mismatch between runoff and precipitation after the abrupt change point of runoff in 1989, possibly explainable by continuous rises of annual mean temperature and evapotranspiration from 1958 to 2017, especially after 2000.
The SPI12 of precipitation exhibited similar patterns of changes to that of runoff, including an abrupt change point in 1987 and four- and eight-year cyclic patterns for the period 1958-1988; the patterns changed to six-year and two intensified two-year cycles during 1989-2017, inconsistent to changes in runoff over the same time period.
References
[1] et alThe impacts of climate change across the globe: A multi-sectoral assessment. Climate Change, 134, 457-474(2016).
[2] Yellow River Water Resources Bulletins 1989-2008(1989).
[3] et alHuman-induced changes in the hydrology of the western United States. Science, 319, 1080-1083(2008).
[4] et alDetection and attribution of temperature changes in the mountainous western United States. Journal of Climate, 21, 6404-6424(2008).
[5] et alThreats to water supplies in the tropical Andes. Science, 312, 1755-1756(2006).
[6] Spatial and temporal aspects of the transition from connection to disconnection between rivers, lakes and groundwater. Journal of Hydrology, 376, 159-169(2009).
[7] et alGlacier recession and human vulnerability in the Yanamarey watershed of the Cordillera Blanca, Peru. Climate Change, 105, 179-206(2011).
[8] The potential evapotranspiration (PE) index for vegetation and vegetation-climatic classification (2): An introduction of main methods and PEP program. Chinese Journal of Plant Ecology, 13, 197-207(1989).
[9] et alA review of land use change and its influence in the source region of the Yellow River. Resources Science, 42, 446-459(2020).
[10] Quantifying the effects of climate variability and human activities on runoff for Kaidu River Basin in arid region of northwest China. Theoretical and Applied Climatology, 111, 537-545(2013).
[11] et alPrecipitation elasticity of streamflow in catchments across the world. IAHS Publication, 308, 256-262(2006).
[12] et alObserved hydrologic non-stationarity in far south-eastern Australia: Implications for modelling and prediction. Stochastic Environmental Research and Risk Assessment, 28, 3-15(2014).
[13] The impacts of climate change and land cover/use transition on the hydrology in the upper Yellow River Basin, China. Journal of Hydrology, 502, 37-52(2013).
[14] Climate of China, 392-418(2013).
[15] et alAssessing climate change impacts on water availability of snowmelt-dominated basins of the upper Rio Grande Basin. Journal of Hydrology: Regional Studies, 136, 525-546(2015).
[16] Singular Spectrum Analysis: A New Tool in Time Series Analysis(1997).
[17] et alReconciliation of research on forest carbon sequestration and water conservation. Journal of Forestry Research(2020). https://www.ncbi.nlm.nih.gov/pubmed/32214748
[18] et alThe effects of plant physiological responses to rising CO2 on global streamflow. Nature Climate Change, 9, 873-879(2019).
[19] Effects of human activities and climate variability on water resources in the Saveh plain, Iran. Environmental Monitoring and Assessment(2015). https://www.ncbi.nlm.nih.gov/pubmed/32880731
[20] et alExploring the link between meteorological drought and streamflow: Effects of climate-catchment interaction. Water Resources Research, 50, 2468-2487(2014).
[21] Drought, groundwater storage and stream flow decline in southwestern Australia. Geophysical Research Letters(2012). https://www.ncbi.nlm.nih.gov/pubmed/32713977
[22] Hydrological data of Yellow River basin: Upper reach of upper Yellow River (above Heishan Gorge), 2009-2017(1958).
[23] Climate change will affect the Asian water towers. Science, 328, 1382-1385(2010).
[24] et alVariations of precipitation characteristics during the period 1960-2014 in the Source Region of the Yellow River, China. Journal of Arid Land, 10, 388-401(2018).
[25] Towards understanding hydroclimatic change in Victoria, Australia: Preliminary insights into the ‘Big Dry’. Hydrology and Earth System Sciences, 14, 433-445(2010).
[26] Human factors were dominant drivers of record low streamflow to a surface water irrigation district in the US southern Great Plains. Agricultural Water Management, 185, 93-104(2017).
[27] et alResponse of runoff in the headwater region of the Yellow River to climate change and its sensitivity analysis. Journal of Geographical Sciences, 20, 848-860(2010).
[28] et alAssessing recent declines in Upper Rio Grande runoff efficiency from a paleoclimate perspective. Geophysical Research Letters, 44, 4124-4133(2017).
[29] Impact of recent climate change on the hydrology of coastal Mediterranean rivers in southern France. Climate Change, 99, 425-456(2010).
[30] et alLandform-related permafrost characteristics in the source area of the Yellow River, eastern Qinghai-Tibet Plateau. Geomorphology, 269, 104-111(2016).
[31] Response of runoff to climate change and its future tendency in the source region of Yellow River. Journal of Geographical Sciences, 22, 431-440(2012).
[32] et alTemporal and spatial variations of global solar radiation over the Qinghai-Tibetan Plateau during the past 40 years. Theoretical and Applied Climatology, 113, 573-583(2013).
[33] et alSpatiotemporal variations in productivity and water use efficiency across a temperate forest landscape of Northeast China. Forest Ecosystems, 6(2019).
[34] et alThe spatial-temporal changes of vegetation coverage in the Three-River Headwater Region in recent 12 years. Acta Geographica Sinica, 68, 897-908(2013).
[35] Quantitative estimation of the impact of climate change on actual evapotranspiration in the Yellow River Basin, China. Journal of Hydrology, 395, 226-234(2010).
[36] On the recent warming in the Murray-Darling Basin: Land surface interactions misunderstood. Geophysical Research Letters, 36, 392-395(2009).
[37] et alThermal regime of warm-dry permafrost in relation to ground surface temperature in the source areas of the Yangtze and Yellow rivers on the Qinghai-Tibet Plateau, SW China. Science of the Total Environment, 618, 1033-1045(2018).
[38] et alDecreasing potential evapotranspiration in the Huanghe River Watershed in climate warming during 1960-2010. Journal of Geographical Sciences, 22, 977-988(2012).
[39] et alSoil moisture drought in Europe: A compound event of precipitation and potential evapotranspiration on multiple time scales. Journal of Hydrometeorology, 19, 1255-1271(2018).
[40] Streamflow response to shrinking glaciers under changing climate in the Lidder Valley, Kashmir Himalayas. Journal of Mountain Science, 15, 1241-1253(2018).
[41] Handbook of Hydrology(1993).
[42] The relationship of drought frequency and duration to time scales. Paper presented at 8th Conference on Applied Climatology(1993).
[43] Drought monitoring with multiple time scales(1995).
[44] et alGlobal review and synthesis of trends in observed terrestrial near-surface wind speeds: Implications for evaporation. Journal of Hydrology, 416/417, 182-205(2012).
[45] et alImpacts of recent climate change on the hydrology in the source region of the Yellow River Basin. Journal of Hydrology: Regional Studies, 6, 66-81(2016).
[46] et alClimatic and anthropogenic factors affecting river discharge to the global ocean, 1951-2000. Global and Planetary Change, 62, 187-194(2008).
[47] et alMulti-year droughts in Europe: Analysis of development and causes. Hydrology Research, 43, 689-706(2012).
[48] et alTowards better understanding of changes in rainfall-runoff relationships during the recent drought in south-eastern Australia, 3622-3628(2011).
[49] et alStreamflow decline in southwestern Australia, 1950-2008. Geophysical Research Letters(2010). https://www.ncbi.nlm.nih.gov/pubmed/32713977
[50] An investigation into changes in climate characteristics causing the recent very low runoff in the southern Murray-Darling Basin using rainfall-runoff models. Water Resources Research(2011). https://www.ncbi.nlm.nih.gov/pubmed/30449909
[51] et alImpacts of climate warming on the frozen ground and eco-hydrology in the Yellow River source region, China. Science of the Total Environment, 605/606, 830-841(2017).
[52] Climate warming over the past half century has led to thermal degradation of permafrost on the Qinghai-Tibet Plateau. The Cryosphere, 12, 595-608(2018).
[53] Changes in Australian pan evaporation from 1970 to 2002. International Journal of Climatology, 24, 1077-1090(2004).
[54] et alThe influence of multiyear drought on the annual rainfall-runoff relationship: An Australian perspective. Water Resources Research, 51, 2444-2463(2014).
[55] et alGlobal patterns of drought recovery. Nature, 548, 202-205(2017).
[56] et alResponses of natural runoff to recent climatic variations in the Yellow River Basin, China. Hydrology and Earth System Sciences, 17, 4471-4480(2013).
[57] An approach toward a rational classification of climate. Geographical Review, 38, 55-94(1948).
[58] et alIce core records of climate variability on the Third Pole with emphasis on the Guliya ice cap, western Kunlun Mountains. Quaternary Science Reviews, 188, 1-14(2018).
[59] et alEvidence for a recent warming and wetting in the source area of the Yellow River (SAYR) and its hydrological impacts. Journal of Geographical Sciences, 25, 643-668(2015).
[60] The twenty-first century Colorado River hot drought and implications for the future. Water Resources Research, 53, 2404-2418(2016).
[61] et alHydrological drought across the world: Impact of climate and physical catchment structure. Hydrology and Earth System Sciences Discussions, 17, 1715-1732(2013).
[62] Hydrological drought severity explained by climate and catchment characteristics. Journal of Hydrology, 526, 3-14(2015).
[63] Testing the use of standardised indices and GRACE satellite data to estimate the European 2015 groundwater drought in near-real time. Hydrology and Earth System Sciences, 21, 1947-1971(2017).
[64] Singular spectrum analysis in nonlinear dynamics, with applications to paleoclimatic time series. Physica D Nonlinear Phenomena, 35, 395-424(1989).
[65] Singular-spectrum analysis: A toolkit for short, noisy chaotic signals. Physica D Nonlinear Phenomena, 58, 5-126(1992).
[66] Human and climate impacts on the 21st century hydrological drought. Journal of Hydrology, 526, 208-220(2015).
[67] et alChanges in reference evapotranspiration across the Tibetan Plateau: Observations and future projections based on statistical downscaling. Journal of Geophysical Research Atmospheres, 118, 4049-4068(2013).
[68] et alIncreasing influence of air temperature on upper Colorado River streamflow. Geophysical Research Letters, 43, 2174-2181(2016).
[69] et alA new assessment of hydrological change in the source region of the Yellow River. Water,. 10(7), doi:(2018).
[70] Construction and application of monthly air temperature and precipitation gridded datasets with high resolution (0.025°×0.025°) over China during 1951-2012. Journal of Lanzhou University (Natural Sciences), 50, 213-220(2014).
[71] Complex response of runoff-precipitation ratio to the rising air temperature: The source area of the Yellow River, China. Regional Environmental Change, 15, 35-43(2015).
[72] et alLags in hydrologic recovery following an extreme drought: Assessing the roles of climate and catchment characteristics. Water Resources Research, 53, 4821-4837(2017).
[73] et alClimate change and its driving effect on the runoff in the “Three-River Headwaters” region. Journal of Geographical Sciences, 21, 963-978(2011).
[74] Long-term trend and abrupt change for major climate variables in the upper Yellow River Basin. Acta Meteorologica Sinica, 21, 204-214(2007).
[75] et alStreamflow response to climate variability and human activities in the upper catchment of the Yellow River Basin. Science in China Series E: Technological Sciences, 52, 3249-3256(2009).
[76] Changing trends and regime shift of streamflow in the Yellow River Basin. Stochastic Environmental Research and Risk Assessment, 29, 1331-1343(2015).
[77] Response of water budget to recent climatic changes in the source region of the Yellow River. Chinese Science Bulletin, 57, 2155-2162(2012).