• Journal of Natural Resources
  • Vol. 35, Issue 11, 2596 (2020)
Cheng-liang LIU1、2、3、4, Jie WANG4, and De-bin DU1、2、3、4、*
Author Affiliations
  • 1Institute for Global Innovation and Development, East China Normal University, Shanghai 200062, China
  • 2Institute for Geopolitics and Strategic Geography, East China Normal University, Shanghai 200062, China
  • 3Southern Marine Science and Engineering Guangdong Laboratory (Guangzhou), Guangzhou 511458, China
  • 4School of Human Geography, East China Normal University, Shanghai 200241, China
  • show less
    DOI: 10.31497/zrzyxb.20201104 Cite this Article
    Cheng-liang LIU, Jie WANG, De-bin DU. Spatical dynamics of the territories and balance areas of energy power between the US and China[J]. Journal of Natural Resources, 2020, 35(11): 2596 Copy Citation Text show less
    Theoertical framework of energy power space
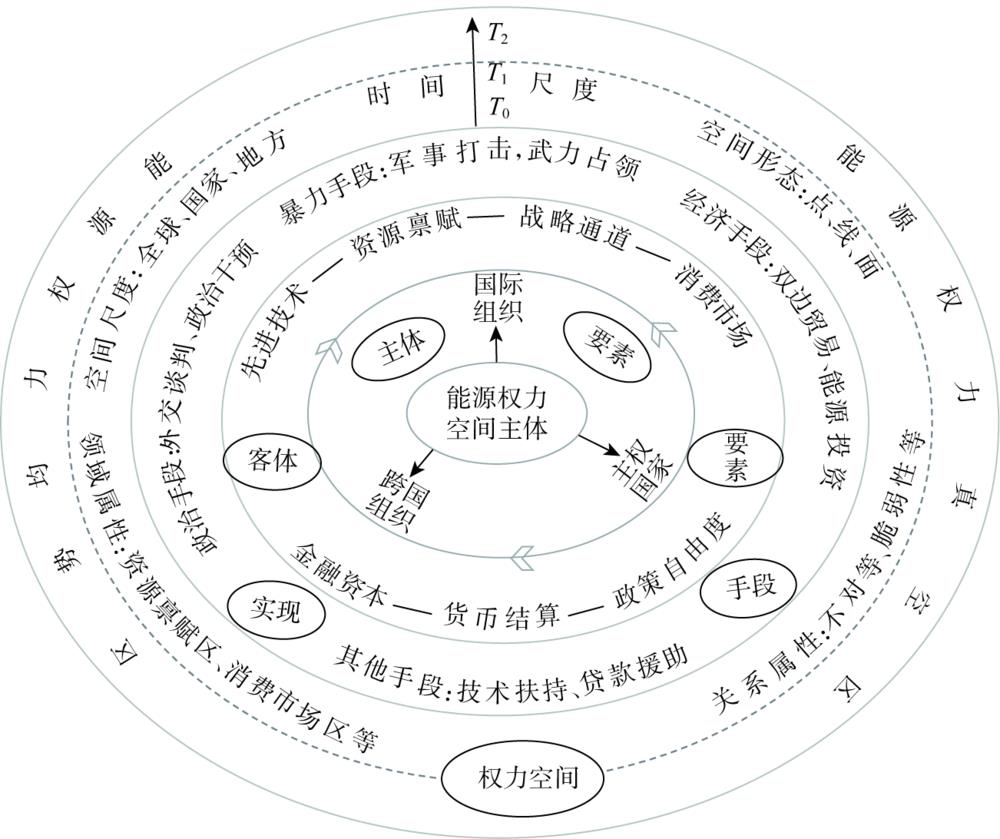
    Fig. 1. Theoertical framework of energy power space
    Balance areas of energy power space
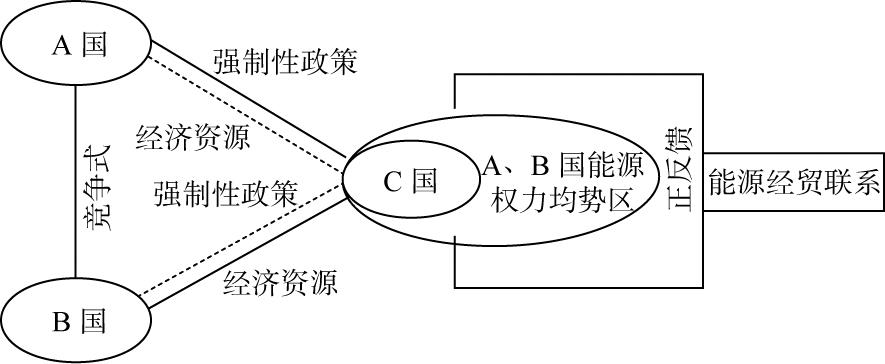
    Fig. 2. Balance areas of energy power space
    权力分区原油天然气
    无权力区权力低能区权力中能区权力高能区EP ≤00<EP ≤0.00020.0002<EP ≤0.010.01<EPEP ≤00<EP ≤0.050.05<EP ≤0.10.1<EPEP ≤00<EP ≤0.0040.004<EP ≤0.030.03<EP
    Table 1. Classification of interdependence types of countries based on classified energy trade
    A国权力归属原油天然气
    B、C两国能源权力均势区B国能源权力区C国能源权力区[-0.0001, 0.0001](-1, -0.0001)(0.0001, 1)[-0.01, 0.01](-1, -0.01)(0.01, 1)[-0.0001, 0.0001](-1, -0.0001)(0.0001, 1)
    Table 2. Classification of state power based on classified energy trade
    年份权力低值区权力中值区权力高值区
    中国美国中国美国中国美国
    2003亚洲(10)欧洲(13)非洲(3)北美洲(2)亚洲(3)欧洲(16)非洲(2)大洋洲(2)北美洲(8)南美洲(5)亚洲(6)大洋洲(2)南美洲(1)亚洲(2)欧洲(2)非洲(3)北美洲(1)南美洲(2)南美洲(2)
    2010亚洲(19)欧洲(9)非洲(5)南美洲(3)亚洲(13)欧洲(12)非洲(4)大洋洲(2)北美洲(7)南美洲(4)亚洲(5)欧洲(1)非洲(1)大洋洲(2)北美洲(1)南美洲(2)亚洲(5)欧洲(18)非洲(2)北美洲(4)南美洲(6)亚洲(1)
    2018亚洲(23)欧洲(2)非洲(3)大洋洲(1)南美洲(6)亚洲(8)欧洲(17)非洲(5)北美洲(2)南美洲(5)亚洲(3)欧洲(1)北美洲(1)亚洲(4)欧洲(9)非洲(4)北美洲(7)南美洲(5)亚洲(1)大洋洲(1)
    原油2003亚洲(16)欧洲(3)非洲(6)大洋洲(2)北美洲(2)南美洲(4)亚洲(12)欧洲(6)非洲(5)大洋洲(2)北美洲(4)南美洲(5)亚洲(2)亚洲(1)非洲(2)南美洲(1)亚洲(1)非洲(1)亚洲(2)非洲(4)南美洲(1)
    2010亚洲(16)欧洲(4)非洲(8)大洋洲(3)北美洲(3)南美洲(6)亚洲(11)欧洲(3)非洲(7)大洋洲(1)北美洲(4)南美洲(4)亚洲(3)非洲(2)亚洲(1)非洲(1)北美洲(1)南美洲(2)亚洲(2)非洲(3)亚洲(1)非洲(6)南美洲(2)
    2018亚洲(16)欧洲(4)非洲(11)大洋洲(1)北美洲(2)南美洲(5)亚洲(16)欧洲(17)非洲(13)大洋洲(1)北美洲(7)南美洲(8)亚洲(2)亚洲(1)非洲(1)南美洲(1)亚洲(2)非洲(5)南美洲(1)南美洲(1)
    天然气2003亚洲(1)亚洲(4)北美洲(3)南美洲(1)非洲(2)北美洲(1)
    2010亚洲(5)欧洲(7)非洲(4)大洋洲(2)北美洲(1)亚洲(13)欧洲(6)非洲(2)大洋洲(1)北美洲(5)南美洲(1)亚洲(2)亚洲(1)北美洲(1)亚洲(1)
    2018亚洲(5)欧洲(7)非洲(4)北美洲(1)南美洲(2)亚洲(11)欧洲(11)非洲(3)大洋洲(0)北美洲(7)南美洲(5)亚洲(4)非洲(1)大洋洲(1)亚洲(1)北美洲(1)亚洲(3)非洲(1)大洋洲(1)
    Table 3. Global spatial distribution of energy power classification in China and the US
    2003年2008年2013年2018年
    亚洲(10)欧洲(12)非洲(1)北美洲(3)南美洲(3)亚洲(15)欧洲(6)非洲(1)北美洲(4)南美洲(2)亚洲(15)欧洲(3)非洲(5)北美洲(1)南美洲(4)亚洲(17)欧洲(4)非洲(2)南美洲(3)
    原油亚洲(10)欧洲(3)非洲(4)大洋洲(2)北美洲(1)南美洲(3)亚洲(10)欧洲(3)非洲(6)大洋洲(2)南美洲(4)亚洲(8)欧洲(3)非洲(6)大洋洲(1)北美洲(2)南美洲(4)亚洲(11)欧洲(7)非洲(5)大洋洲(1)北美洲(2)南美洲(3)
    天然气亚洲(2)欧洲(2)大洋洲(1)南美洲(1)亚洲(8)欧洲(6)非洲(1)北美洲(2)南美洲(1)亚洲(5)欧洲(2)南美洲(1)亚洲(1)欧洲(5)
    Table 4. Number and area of spatial distribution of the energy power balance zone between China and the US
    年份各大洲分布国家数量空间分布变化特征代表性国家
    2003亚洲(10)欧洲(18)非洲(4)大洋洲(3)北美洲(3)南美洲(2)片状分布于欧洲大陆地区,零星分布在区域性大国欧洲大陆大多数国家,如法国、德国、西班牙等;以及南非、印度和澳大利亚等
    2008亚洲(13)欧洲(21)非洲(3)大洋洲(3)北美洲(5)南美洲(1)东亚、东南亚和南亚地区蔓延成片,北美洲分布在加勒比海地区日本、韩国、菲律宾、缅甸和巴基斯坦等中国周边地区
    2013亚洲(14)欧洲(19)非洲(6)大洋洲(1)北美洲(3)南美洲(4)非洲东南部和南美洲呈片状分布,亚太地区稍有减少马达加斯加、莫桑比克等和巴西、阿根廷等国家,还新增英国
    2018亚洲(7)欧洲(14)非洲(5)大洋洲(1)北美洲(3)南美洲(2)欧洲大陆大幅减少,但主要大国仍保留;全球逐渐呈现散点状分布土耳其、巴拿马和摩洛哥等
    Table 5. Global distribution and evolution characteristics of energy power balance zone between China and the US
    Cheng-liang LIU, Jie WANG, De-bin DU. Spatical dynamics of the territories and balance areas of energy power between the US and China[J]. Journal of Natural Resources, 2020, 35(11): 2596
    Download Citation