• Laser & Optoelectronics Progress
  • Vol. 56, Issue 8, 081003 (2019)
Baobao Zong1, Chaofeng Li2, and Qingbing Sang1、*
Author Affiliations
  • 1 Jiangsu Provincial Engineering Laboratory of Pattern Recognition and Computational Intelligence, School of Internet of Things Engineering, Jiangnan University, Wuxi, Jiangsu 214122, China
  • 2 Institute of Logistics Science & Engineering, Shanghai Maritime University, Shanghai 200135, China;
  • show less
    DOI: 10.3788/LOP56.081003 Cite this Article Set citation alerts
    Baobao Zong, Chaofeng Li, Qingbing Sang. 3D Image Saliency Detection Based on Log-Gabor Filtering and Saliency Map Fusion Optimization[J]. Laser & Optoelectronics Progress, 2019, 56(8): 081003 Copy Citation Text show less
    Framework of stereoscopic image saliency detection model
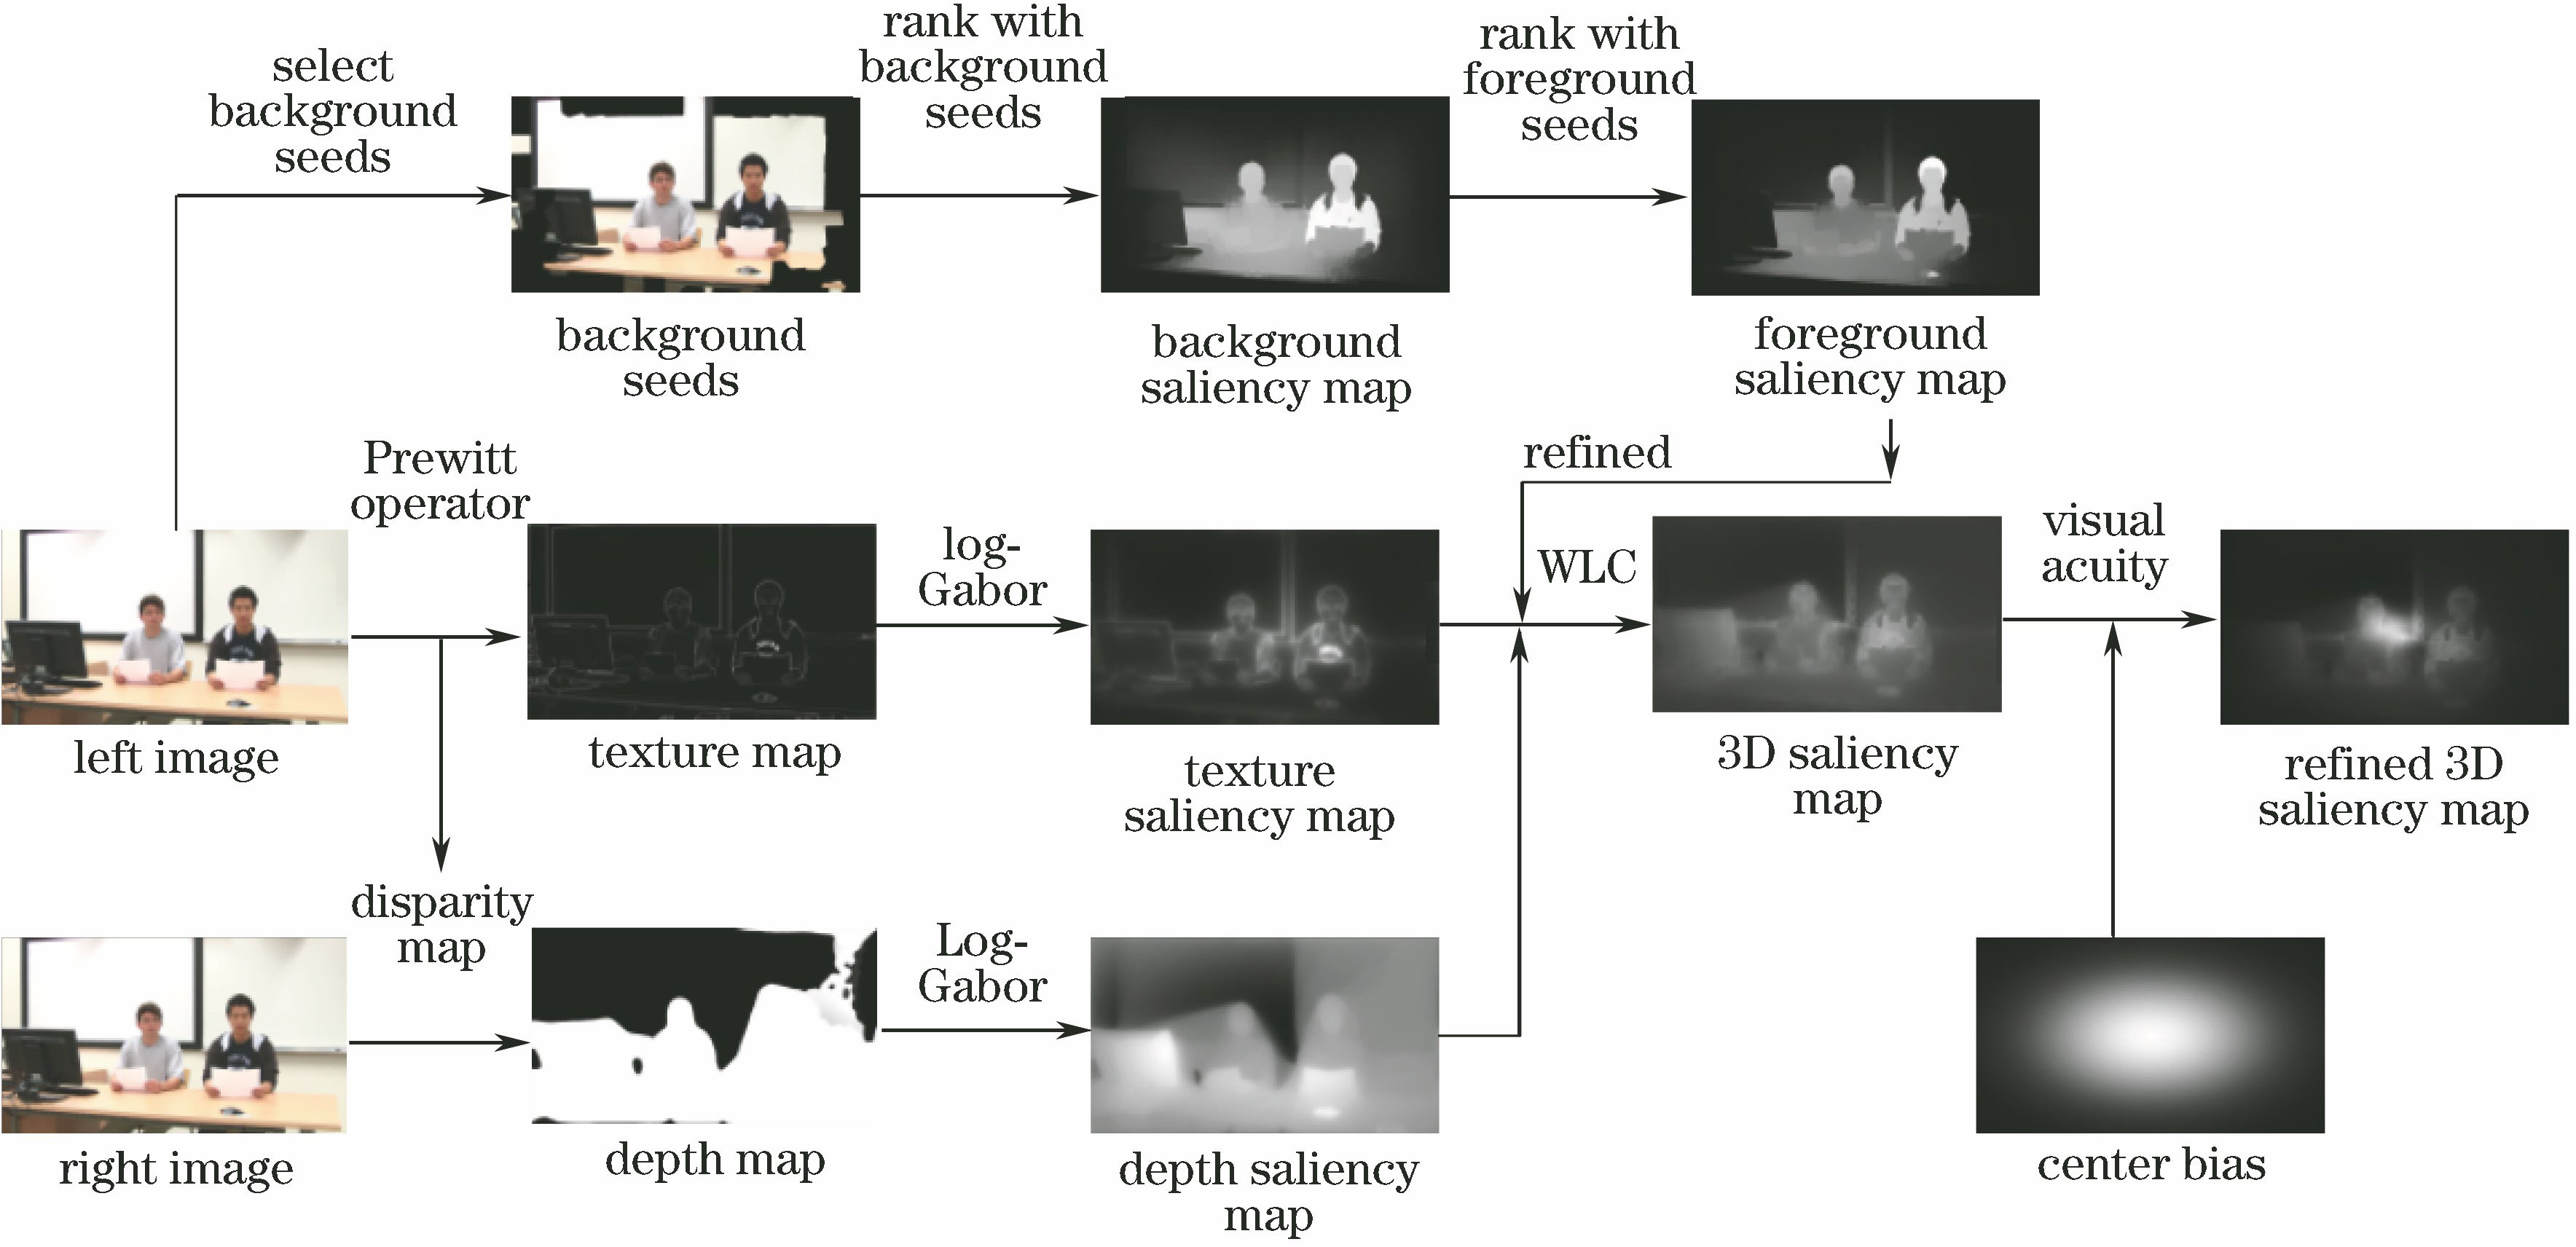
    Fig. 1. Framework of stereoscopic image saliency detection model
    Saliency map in each step. (a) Input image; (b) background map; (c) foreground map; (d) optimized map; (e) fixation density map
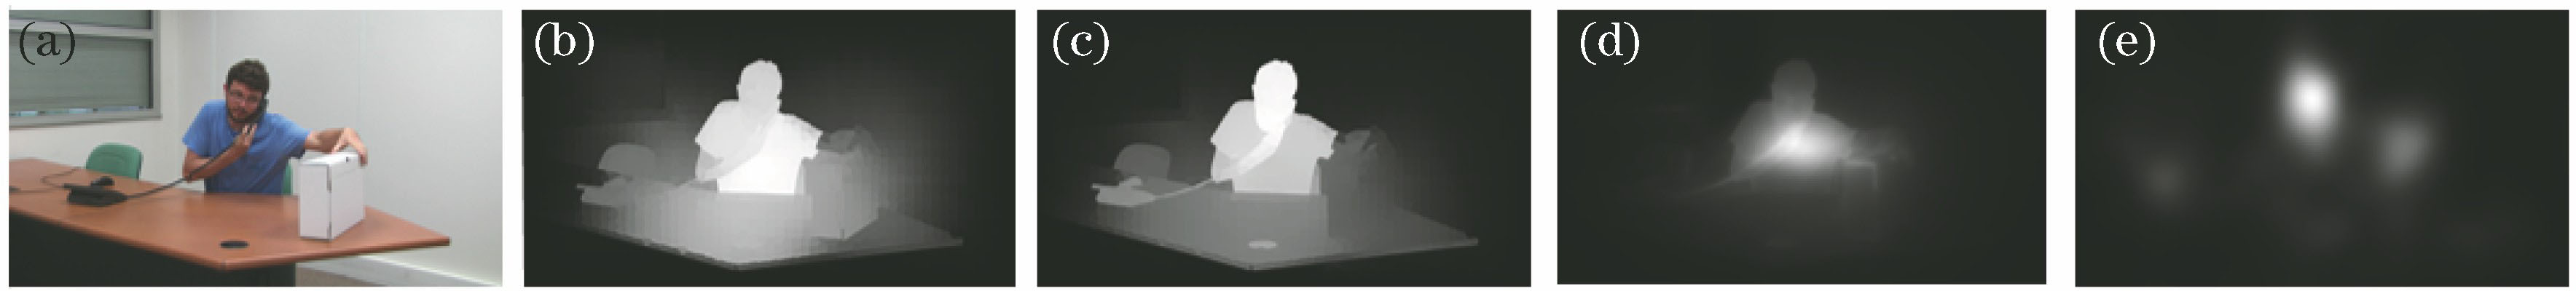
    Fig. 2. Saliency map in each step. (a) Input image; (b) background map; (c) foreground map; (d) optimized map; (e) fixation density map
    Visual comparison among different saliency maps. (a) Input left view image;(b) left view image saliency map; (c) texture saliency map; (d) depth saliency map; (e) 3D saliency map; (f) enhanced 3D saliency map; (g) fixation density map
    Fig. 3. Visual comparison among different saliency maps. (a) Input left view image;(b) left view image saliency map; (c) texture saliency map; (d) depth saliency map; (e) 3D saliency map; (f) enhanced 3D saliency map; (g) fixation density map
    ROC curves of different saliency maps
    Fig. 4. ROC curves of different saliency maps
    P-R curves of different saliency maps
    Fig. 5. P-R curves of different saliency maps
    ROC curves of different models
    Fig. 6. ROC curves of different models
    P-R curves of different models
    Fig. 7. P-R curves of different models
    Saliency mapPLCCKLDAUC
    Left view0.5630.3660.713
    Texture0.2230.3880.589
    Depth0.4660.2110.631
    3D0.7110.2130.759
    Table 1. Performance comparison among different saliency maps
    ModelPLCCKLDAUC
    Model in Ref. [6]0.4100.6050.670
    Model in Ref. [5]0.3420.5520.619
    Model in Ref. [8]0.6600.2880.681
    Model in Ref. [7]0.7030.2600.740
    Proposed0.7110.2130.759
    Table 2. Performance comparison among different models
    ModelTime cost /s
    Model in Ref. [6]3.412
    Model in Ref. [5]1.498
    Model in Ref. [8]0.319
    Model in Ref. [7]87.609
    Proposed18.281
    Table 3. Computation time of each saliency detection model
    Baobao Zong, Chaofeng Li, Qingbing Sang. 3D Image Saliency Detection Based on Log-Gabor Filtering and Saliency Map Fusion Optimization[J]. Laser & Optoelectronics Progress, 2019, 56(8): 081003
    Download Citation