
Guang Han, Jingjing Gao, Mengru Tu, Jia Shi, Zhenhua Pan, Hongli Chen. Effect of Photobiomodulation Mediated by 808 nm Laser on Active Oxygen Steady-State in CCC-ESFs under High Glucose Environment[J]. Laser & Optoelectronics Progress, 2021, 58(9): 0917001
- Laser & Optoelectronics Progress
- Vol. 58, Issue 9, 0917001 (2021)
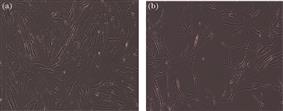
Fig. 1. Cell morphology observation results. (a) Normal medium; (b) high glucose medium
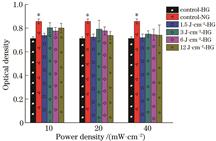
Fig. 2. Absorbance of CCC-ESFs irradiated by 808 nm laser with different power densities (n=3;* means p<0.05, compared with high glucose control group)
Fig. 3. Absorbance of CCC-ESFs irradiated by 808 nm laser with different energy densities (n=3; * means p<0.05, compared with high glucose control group;** means p<0.01, compared with high glucose control group)
Fig. 4. Intracellular ROS level (n=3; * means p<0.05, compared with normal glucose control group; ** means p<0.01, compared with normal glucose control group; # means p<0.05, compared with high glucose control group; ## means p<0.01, compared with high glucose control group)
Fig. 5. Total intracellular SOD level (n=3; * means p<0.05, compared with normal glucose control group; ** means p<0.01, compared with normal glucose control group; # means p<0.05, compared with high glucose control group)
Fig. 6. TAC level of cells (n=3; * means p<0.05, compared with normal glucose control group; ** means p<0.01, compared with normal glucose control group; # means p<0.05, compared with high glucose control group; ## means p<0.01, compared with high glucose control group)
Fig. 7. Intracellular mitochondrial membrane potential level
|
Table 1. Irradiation parameters
|
Table 2. Laser irradiation dose
| |||||||||||||||||||||||||||||||||||||||||
Table 3. NF-κB, TNF-α and IL-1β levels of cells irradiated by 808 nm laser

Set citation alerts for the article
Please enter your email address
© Copyright 2018-2021 | Chinese Laser Press. All Rights Reserved 沪ICP备15018463号-20