Author Affiliations
1Changchun Institute of Optics, Fine Mechanics and Physics, Chinese Academy of Sciences, Changchun, Jilin 130033, China2University of Chinese Academy of Sciences, Beijing 100049, China3Optical-Mechanical Structure Research Laboratory, Chang Guang Satellite Technology Co., LTD, Changchun, Jilin 130031, Chinashow less
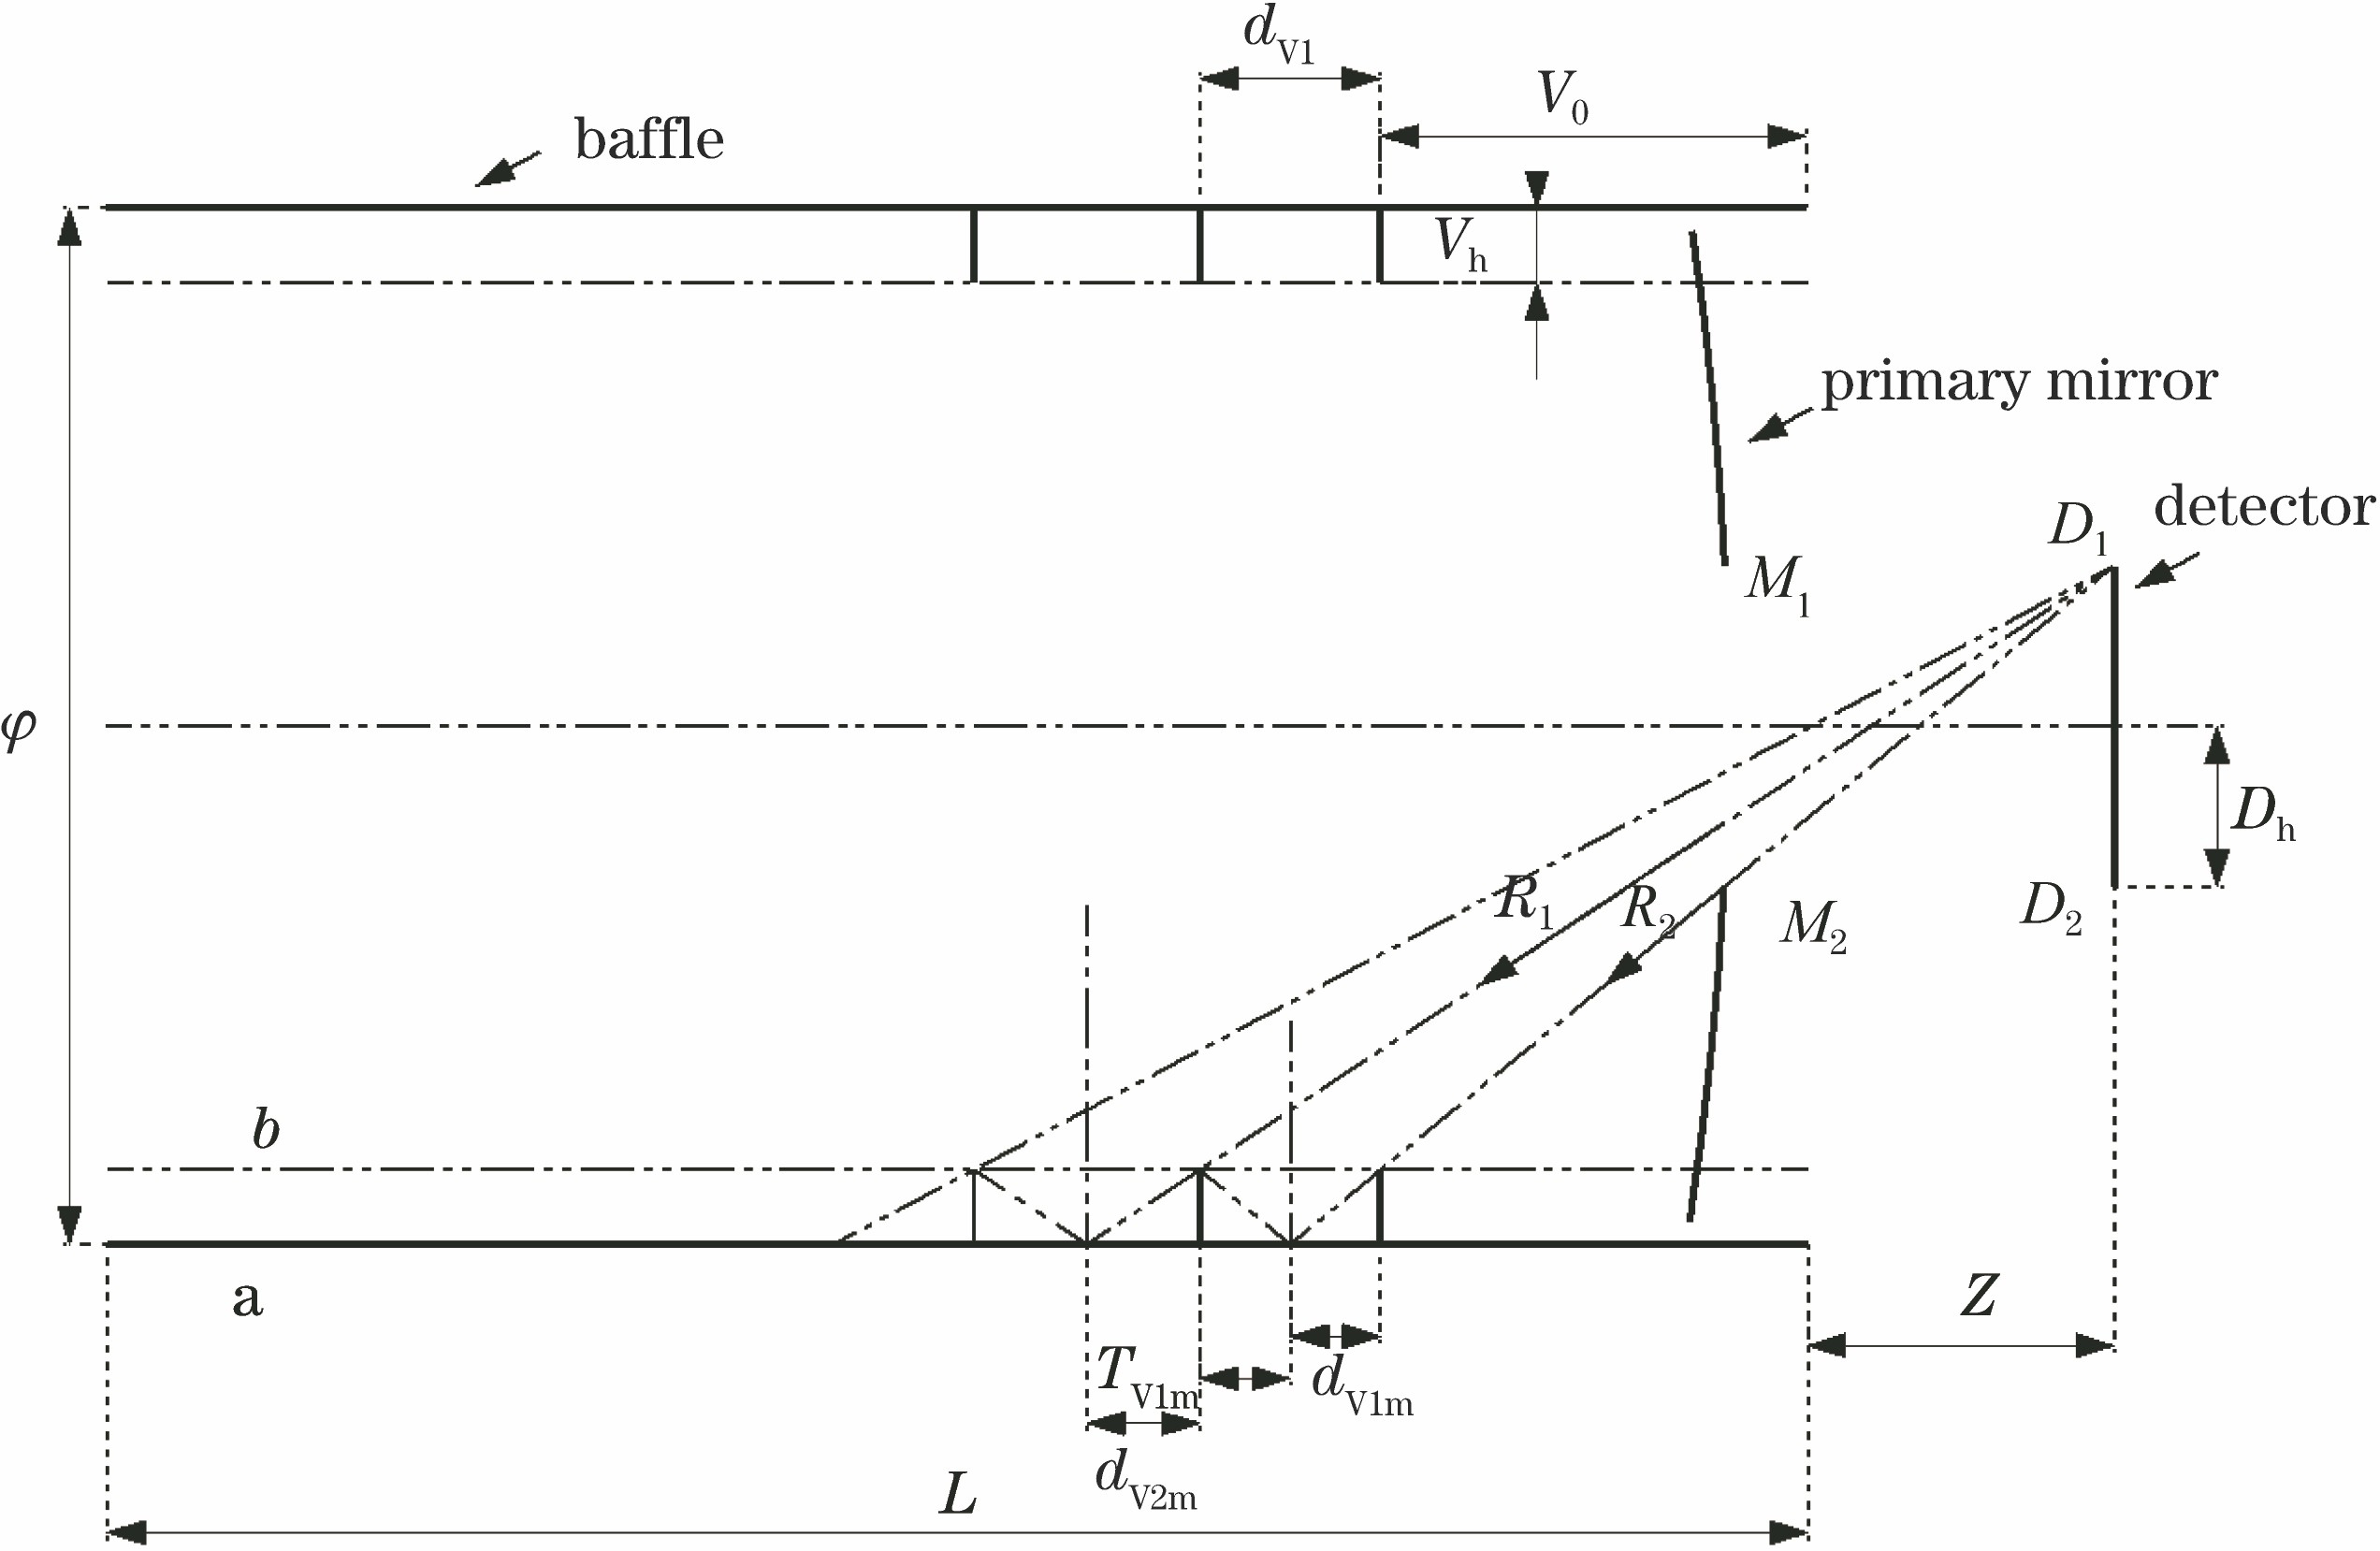
Fig. 1. Parameters pertinent to design of vanes of the primary mirror baffle
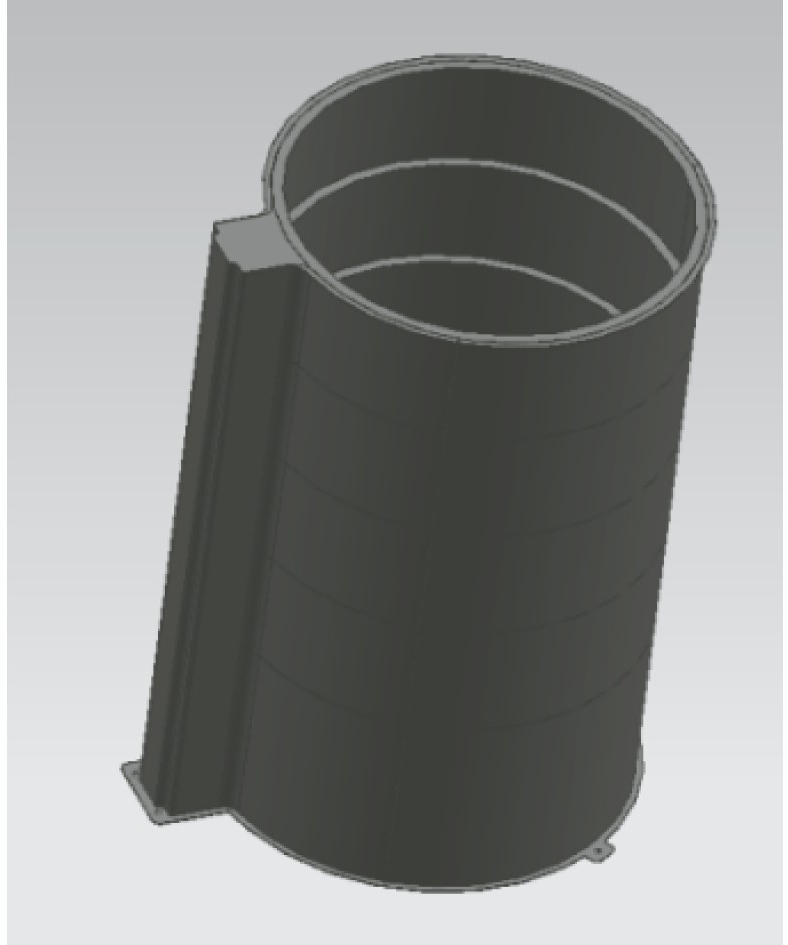
Fig. 2. Initial structure of primary mirror baffle
Fig. 3. Finite element model and structural parameters of primary mirror baffle
Fig. 4. Nephograms of x- and y-direction vibration modes of fundamental frequency of baffle. (a) x direction; (b) y direction
Fig. 5. Iteration process of object optimization. (a) Iterative curve of mass; (b) iterative curve of structural compliance
Fig. 6. Scene of random vibration test
Fig. 7. Frequency response curve of random vibration of sampling point. (a) x axis; (b) y axis; (c) z axis
Fig. 8. Model for tray light analysis
Fig. 9. PST curves of optical system in x and y directions. (a) PST curve in x direction; (b) PST curve in y direction
Matetial | Longitudinal tensile elastic modulus /GPa | Lateral tensile elastic modulus /GPa | Longitudinal Poisson's ratio | Lateral Poisson's ratio | Shear modulus /GPa |
---|
CFRP | 230.00 | 9.30 | 0.27 | 6.65 | 6.20 |
|
Table 1. Performance parameters of CFRP
Variable | Range /mm | Initial value /mm | Optimization result /mm | Amended result /mm |
---|
Tt1 | [0.2,0.6] | 0.5 | 0.59 | 0.48 | Tt2 | [0.2,0.6] | 0.5 | 0.26 | 0.24 | Tt3 | [0.2,0.6] | 0.5 | 0.22 | 0.24 | Tt4 | [0.2,0.6] | 0.5 | 0.23 | 0.24 | Tt5 | [0.2,0.6] | 0.5 | 0.24 | 0.24 | Tt6 | [0.2,0.6] | 0.5 | 0.37 | 0.48 | Ton | [0.6,1.0] | 1.0 | 0.67 | 0.72 | Tunder | [0.6,1.0] | 1.0 | 0.98 | 0.98 | Trib | [0.2,0.6] | 0.5 | 0.23 | 0.24 | Tdgh | [0.2,0.6] | 0.5 | 0.34 | 0.24 |
|
Table 2. Designed variables and optimized results
Performance | /Hz | /Hz | Compliance /(N·mm) | Mass /g |
---|
Initial value | 95 | 117.9 | 0.03 | 397.5 | Optimization result | 125.2 | 146.7 | 0.01 | 243.8 | Improvement /% | 31.79 | 24.4 | 66.6 | 38.6 |
|
Table 3. Structural performance comparisonbefore and after optimization
Frequency /Hz | Power spectral density /(g2·Hz-1) | Acceleration root mean square /g |
---|
10 | 0.0000 | 3.56 | 80 | 0.0100 | 800 | 0.0100 | 8000 | 0.0016 |
|
Table 4. Test conditions of random vibration
Direction | Comparison results of frequency scanning test with modal analysis | Comparison results of random vibration test with analysis |
---|
Analysis value of fundamental frequency /Hz | Test value of fundamental frequency /Hz | Relative error /% | | Analysis value of acceleration response /g | Test value of acceleration response /g | Relative error /% |
---|
x | 125.20 | 125.39 | 0.15 | 12.84 | 11.20 | 12.70 | y | 146.70 | 128.42 | 12.46 | 11.20 | 8.99 | 10.30 | z | 609.67 | 635.45 | 4.23 | 10.90 | 10.11 | 7.80 |
|
Table 5. Comparison between test and analysis data