
Jia Wang, Ming Zeng, Dazhang Li, Xiaoning Wang, Wei Lu, Jie Gao. Injection induced by coaxial laser interference in laser wakefield accelerators[J]. Matter and Radiation at Extremes, 2022, 7(5): 054001
- Matter and Radiation at Extremes
- Vol. 7, Issue 5, 054001 (2022)
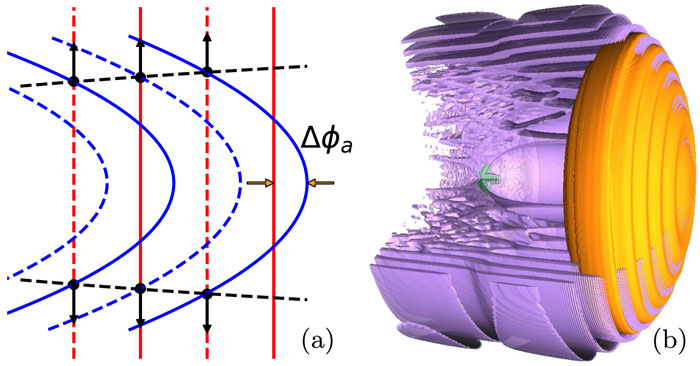
Fig. 1. Illustration of the coaxial interference of the two laser pulses (a), which creates an onion-like plasma wake (b) in the proposed injection scheme. (a) The driver laser (red lines) is relatively loosely focused and the trigger laser (blue lines) is tightly focused, with the peak wavefront illustrated by solid lines and the valley wavefront by dashed lines. Both lasers move to the right. The axial phase difference of the two lasers is Δϕ a . The intersections of different types of lines, marked as black dots, are destructive points (rings in cylindrical geometry). The lines connecting the black dots become the subcavity sheath of the wakefield. The black arrows indicate the direction of motion of the sheath. (b) Isosurface plot of the laser (orange), plasma (violet), and injected electron beam (cyan) from a 3D simulation. A quarter of the plasma is cut away to show the interior.
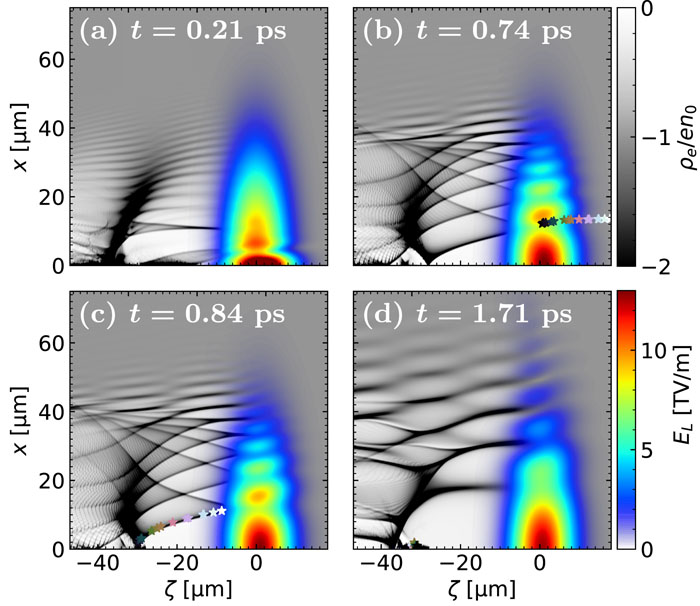
Fig. 2. Simulation of the proposed injection scheme. A driver laser with peak power 227.13 TW is focused to a waist of w 00 = 30 µ m, and a trigger laser with peak power 1.88 TW is focused to a waist of w 01 = 2 µ m. In the plots, the profile of the summation of the electric fields of both lasers is shown as E L by omitting the oscillation in the laser frequency scale. The snapshots show the innermost subcavity: (a) this subcavity is not big enough to sustain an injection; (b) it is big enough, and injection starts; (c) it is expanding, and injection continues; (d) it reaches its maximum size, and injection stops. A sample of injected electrons are marked as stars.
Fig. 3. Plots showing injection, self-dechirping, and beam quality. (a) Evolution of the axial longitudinal electric field E z . The contour of the laser pulse front is shown as a green dash-dotted line and those of the head and tail of the injected electron beam as yellow solid and dashed lines, respectively. (b) and (c) Snapshots at t = 6.39 and 28.06 ps (before and after self-dechirping). The phase spaces and energy spectra of the injected electron beam at these two instants of time are shown in (d) and (f) and in (e) and (g), respectively. The energy spread, the charge within threefold energy spread (colored areas), and the normalized emittance in the (x , y ) directions are (f) 0.4%, 120 pC, (0.15, 0.05) mm mrad and (g) 0.34%, 120 pC, (0.25, 0.5) mm mrad. The total charge of this beam is 170 pC which does not change with time after injection has finished.
Fig. 4. Dependence of the peak superimposed axial electric field of the two lasers E p and the injected charge on the initial phase difference of the two lasers Δϕ −∞, which is varied by changing Δz 0 while keeping Δϕ CEP = 0. (a) E p vs z for different Δϕ −∞ cases. The solid lines represent the theoretical values and the scatter points are from simulations. (b) Beam charge after injection has finished (blue) and E p at z = 150 µ m (yellow) vs Δϕ −∞ obtained from simulations.


Set citation alerts for the article
Please enter your email address

© Copyright 2018-2021 | Chinese Laser Press. All Rights Reserved 沪ICP备15018463号-20