• Advanced Photonics
  • Vol. 1, Issue 2, 026001 (2019)
Bo Qiang1、2, Alexander M. Dubrovkin1, Harish N. S. Krishnamoorthy1, Qian Wang3, Cesare Soci1, Ying Zhang4, Jinghua Teng3, and Qi Jie Wang1、2、*
Author Affiliations
  • 1Nanyang Technological University, Centre for Disruptive Photonic Technologies, The Photonic Institute, School of Physical and Mathematical Sciences, Singapore
  • 2Nanyang Technological University, Centre for OptoElectronics and Biophotonics, School of Electrical and Electronic Engineering, Singapore
  • 3Agency for Science, Technology and Research, Institute of Materials Research and Engineering, Singapore
  • 4Agency for Science, Technology and Research, Institute of Manufacturing Technology, Singapore
  • show less
    DOI: 10.1117/1.AP.1.2.026001 Cite this Article Set citation alerts
    Bo Qiang, Alexander M. Dubrovkin, Harish N. S. Krishnamoorthy, Qian Wang, Cesare Soci, Ying Zhang, Jinghua Teng, Qi Jie Wang. High Q-factor controllable phononic modes in hybrid phononic–dielectric structures[J]. Advanced Photonics, 2019, 1(2): 026001 Copy Citation Text show less
    Localized hybrid phonon resonance of Ge grating on SiC. (a) SEM image of the grating (w=2 μm and P=4 μm). Scale bar equals 4 μm. (b) Measured absorption spectrum of gratings in (a) and its double-Lorentzian fittings. Simulated intensity distribution of the (c) dipolar and (d) higher order mode. White dashed lines indicate the SiC–air interface. Scale bar equals 4 μm. (e) and (f) Percentage of total energy localized within a distance d above the SiC surface in the total energy above the SiC surface.
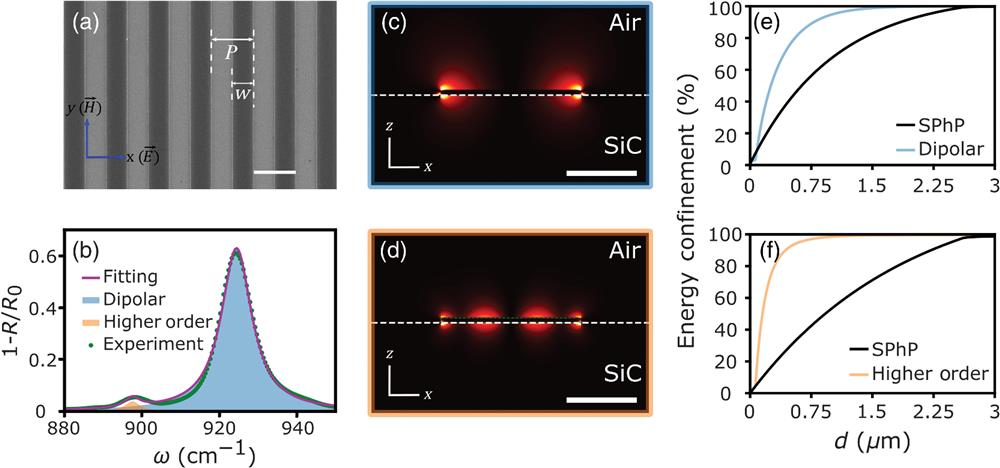
    Fig. 1. Localized hybrid phonon resonance of Ge grating on SiC. (a) SEM image of the grating (w=2  μm and P=4  μm). Scale bar equals 4  μm. (b) Measured absorption spectrum of gratings in (a) and its double-Lorentzian fittings. Simulated intensity distribution of the (c) dipolar and (d) higher order mode. White dashed lines indicate the SiC–air interface. Scale bar equals 4  μm. (e) and (f) Percentage of total energy localized within a distance d above the SiC surface in the total energy above the SiC surface.
    Coupling of the propagating SPhP mode with the hybrid phononic–dielectric dipolar mode in Ge gratings with varying period P and fixed width (w=2 μm): (a) experimental normalized absorption and (b) simulated normalized absorption. The yellow, magenta, and green dashed lines indicate phase-matching conditions of SPhP modes with m=−1, 1, and −2, respectively. (c) Absorption of the grating when w=2 μm and P=8 μm. Shaded areas represent multi-Lorentzian decomposition of the spectrum. Purple dots and blue lines represent experimental data and the fitted spectrum, respectively. (d)–(f) Real parts of the Ez for the green, magenta, and red dots shown in (b), respectively. The scale bar represents 2 μm.
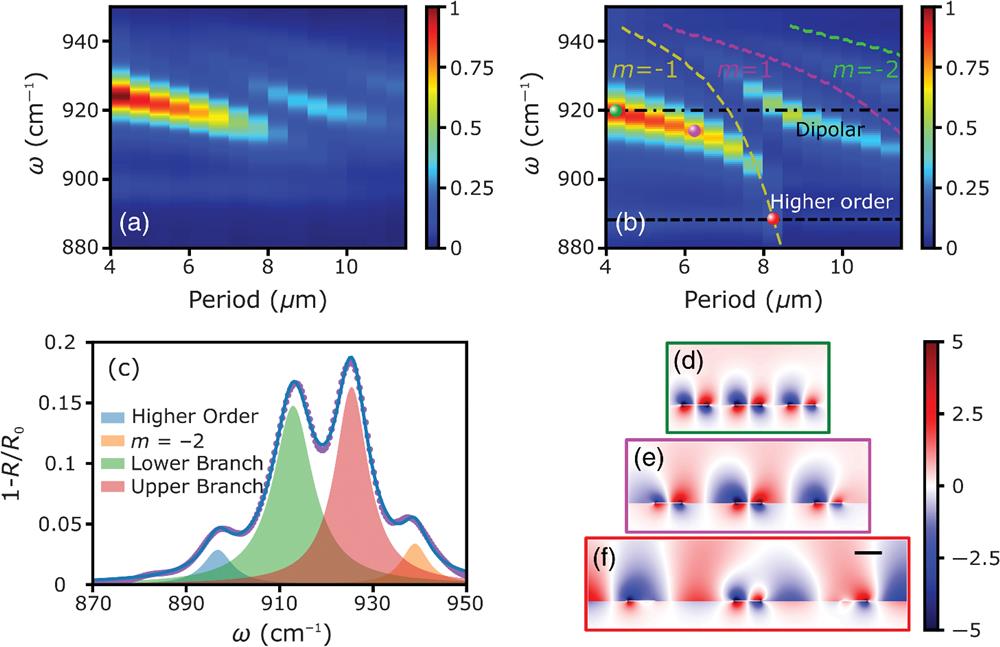
    Fig. 2. Coupling of the propagating SPhP mode with the hybrid phononic–dielectric dipolar mode in Ge gratings with varying period P and fixed width (w=2  μm): (a) experimental normalized absorption and (b) simulated normalized absorption. The yellow, magenta, and green dashed lines indicate phase-matching conditions of SPhP modes with m=1, 1, and 2, respectively. (c) Absorption of the grating when w=2  μm and P=8  μm. Shaded areas represent multi-Lorentzian decomposition of the spectrum. Purple dots and blue lines represent experimental data and the fitted spectrum, respectively. (d)–(f) Real parts of the Ez for the green, magenta, and red dots shown in (b), respectively. The scale bar represents 2  μm.
    Coupling of the propagating SPhP mode with the hybrid phononic–dielectric dipolar mode in Ge gratings with varying period P and fixed width (w=1 μm): (a) experimental normalized absorption and (b) simulated normalized absorption. The yellow and magenta dashed lines indicate the phase-matching condition of SPhP mode with m=−1 and 1, respectively.
    Fig. 3. Coupling of the propagating SPhP mode with the hybrid phononic–dielectric dipolar mode in Ge gratings with varying period P and fixed width (w=1  μm): (a) experimental normalized absorption and (b) simulated normalized absorption. The yellow and magenta dashed lines indicate the phase-matching condition of SPhP mode with m=1 and 1, respectively.
    Bo Qiang, Alexander M. Dubrovkin, Harish N. S. Krishnamoorthy, Qian Wang, Cesare Soci, Ying Zhang, Jinghua Teng, Qi Jie Wang. High Q-factor controllable phononic modes in hybrid phononic–dielectric structures[J]. Advanced Photonics, 2019, 1(2): 026001
    Download Citation