
Chenyang Shi, Yandan Lin. LED Ring Array Design for Uniform Illumination Imaging in Machine Vision[J]. Acta Optica Sinica, 2020, 40(20): 2011003
- Acta Optica Sinica
- Vol. 40, Issue 20, 2011003 (2020)
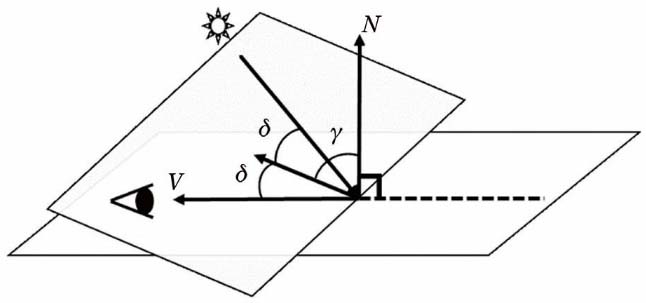
Fig. 1. Geometry of surface reflection
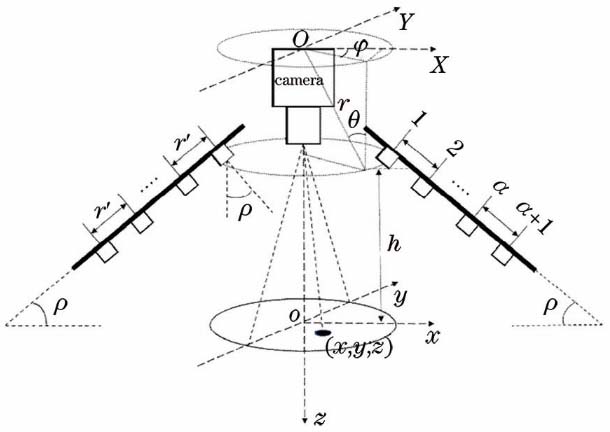
Fig. 2. Schematic of LED ring array illumination model
Fig. 3. Flow chart of LED ring array illumination design
Fig. 4. Illumination distribution of different radius with ρ=0° in single ring. (a)--(e) Illumination uniformity is 23.85%, 22.50%, 20.35%, 17.79%, and 15.51%, respectively
Fig. 5. Normalized illumination distribution and illumination distribution of central line corresponding to the combination of A3-B1-C1-D1. (a) Illumination distribution; (b) illumination distribution of central line
Fig. 6. Relation between uniformity and irradiating angle
Fig. 7. Light intensity at different irradiating angles. (a) ρ=0°; (b) ρ=20°; (c) ρ=40°
Fig. 8. Normalized illumination corresponding to irradiating angle of 20°. (a) 2D map of illumination distribution; (b) illumination distribution map of central line; (c) 3D map of illumination distribution
Fig. 9. Schematic of experimental system. (a) Designed LED ring array; (b) experimental setup
Fig. 10. 3D sample imaging effect under different illuminating conditions. (a) Sample image; (b) image taken in optimal light environment; (c)--(f) images in non-uniform light environment
Fig. 11. Sample details. (a) 3D sample image in optimal light environment; (b) corresponding gray level map
Fig. 12. Corresponding light spot and gray distribution in optimal light environment. (a) Light spot; (b) 3D gray level distribution in central area
|
Table 1. Illumination uniformity distribution of LED ring array at ρ=0°
|
Table 2. Influence factors and level setting for machine vision light environment
|
Table 3. Simulation of direct intersection table
|
Table 4. Corresponding S/N value of different level values
|
Table 5. ANOVA results of uniformity
|
Table 6. Parameters of test luminaire

Set citation alerts for the article
Please enter your email address
© Copyright 2018-2021 | Chinese Laser Press. All Rights Reserved 沪ICP备15018463号-20