
Hao Wang, Dongmei Song, Bin Wang, Song Dai. Fracture Zone Extraction Method Based on Three-Dimensional Convolutional Neural Network Combined with PointSIFT[J]. Laser & Optoelectronics Progress, 2023, 60(24): 2410011
- Laser & Optoelectronics Progress
- Vol. 60, Issue 24, 2410011 (2023)
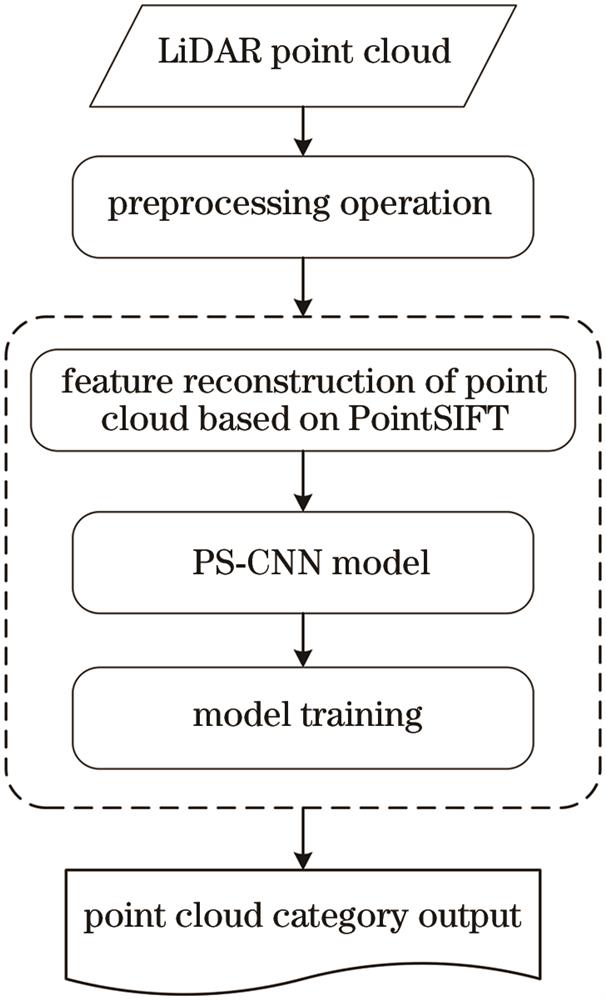
Fig. 1. Flow chart of LiDAR point cloud fracture zone extraction method

Fig. 2. Schematic diagram of OE convolution unit. (a) Point cloud in 3D space (the input point is at origin); (b) nearest neighbour search in eight octants; (c) convolution along X, Y, Z axis
Fig. 3. PointSIFT module
Fig. 4. Schematic diagram of three-dimensional convolution module framework
Fig. 5. Schematic diagram of PS-CNN point cloud fracture zone extraction framework
Fig. 6. Sample display diagrams of ISPRS point cloud datasets. (a); Samp51; (b) Samp53
Fig. 7. Sample display diagrams of Chuandian point cloud datasets. (a) CD_1; (b) CD_2
Fig. 8. Results of three fracture zone extraction methods on Samp51. (a) Label; (b) TD; (c) DNN; (d) PS-CNN
Fig. 9. Results of three fracture zone extraction methods on Samp53. (a) Label; (b) TD; (c) DNN; (d) PS-CNN
Fig. 10. Results of three fracture zone extraction methods on CD_1. (a) Label; (b) TD; (c) DNN; (d) PS-CNN
Fig. 11. Results of three fracture zone extraction methods on CD_2. (a) Label; (b) TD; (c) DNN; (d) PS-CNN
|
Table 1. Confusion matrix of classification results and evaluation errors calculation method
|
Table 2. Performance comparison of three fracture zone extraction methods on ISPRS dataset
|
Table 3. Performance comparison of three fracture zone extraction methods on Chuandian dataset
|
Table 4. Performance comparison of three fracture zone extraction methods on ISPRS dataset
|
Table 5. Performance comparison of the proposed method on point cloud samples with different dilution rate

Set citation alerts for the article
Please enter your email address
© Copyright 2018-2021 | Chinese Laser Press. All Rights Reserved 沪ICP备15018463号-20