• Chinese Optics Letters
  • Vol. 13, Issue 7, 071601 (2015)
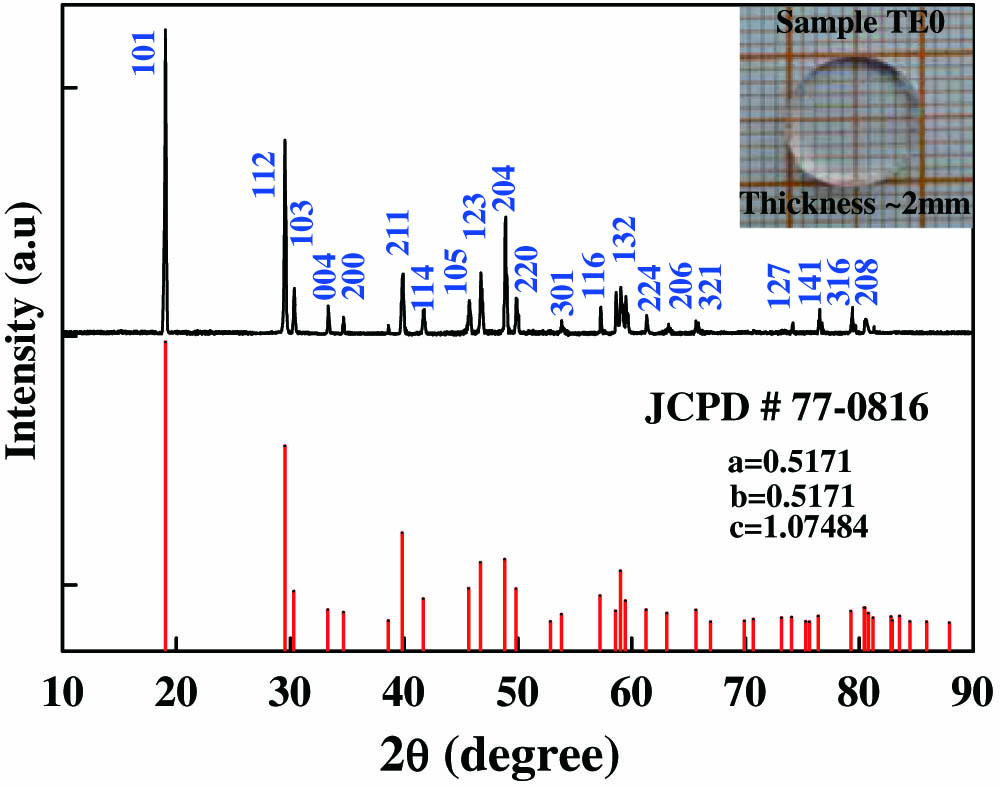
Yongzhang Jiang1, Haiping Xia1、*, Shuo Yang1, Jiazhong Zhang1, Dongsheng Jiang1, Cheng Wang1, Zhigang Feng1, Jian Zhang1, Xuemei Gu1, Jianli Zhang1, Haochuan Jiang2, and Baojiu Chen3
Author Affiliations
  • 1Key Laboratory of Photo-Electronic Materials, Ningbo University, Ningbo 315211, China
  • 2Ningbo Institute of Materials Technology and Engineering, Chinese Academy of Sciences, Ningbo 315211, China
  • 3Department of Physics, Dalian Maritime University, Dalian 116026, China
  • show less
    DOI: 10.3788/COL201513.071601 Cite this Article Set citation alerts
    Yongzhang Jiang, Haiping Xia, Shuo Yang, Jiazhong Zhang, Dongsheng Jiang, Cheng Wang, Zhigang Feng, Jian Zhang, Xuemei Gu, Jianli Zhang, Haochuan Jiang, Baojiu Chen. Luminescence of Tb3+/Eu3+ codoped LiYF4 single crystals under UV excitation for white-light LEDs[J]. Chinese Optics Letters, 2015, 13(7): 071601 Copy Citation Text show less
    Powder XRD pattern of Tb3+/Eu3+ co-doped LiYF4 crystal (TE0). The standard pattern of the LiYF4 crystal is shown. Inset, LiYF4 single crystal (TE0).
    Fig. 1. Powder XRD pattern of Tb3+/Eu3+ co-doped LiYF4 crystal (TE0). The standard pattern of the LiYF4 crystal is shown. Inset, LiYF4 single crystal (TE0).
    Absorption spectra of Samples T0 and TE0, and the un-doped crystals (marked a, b, and c, respectively).
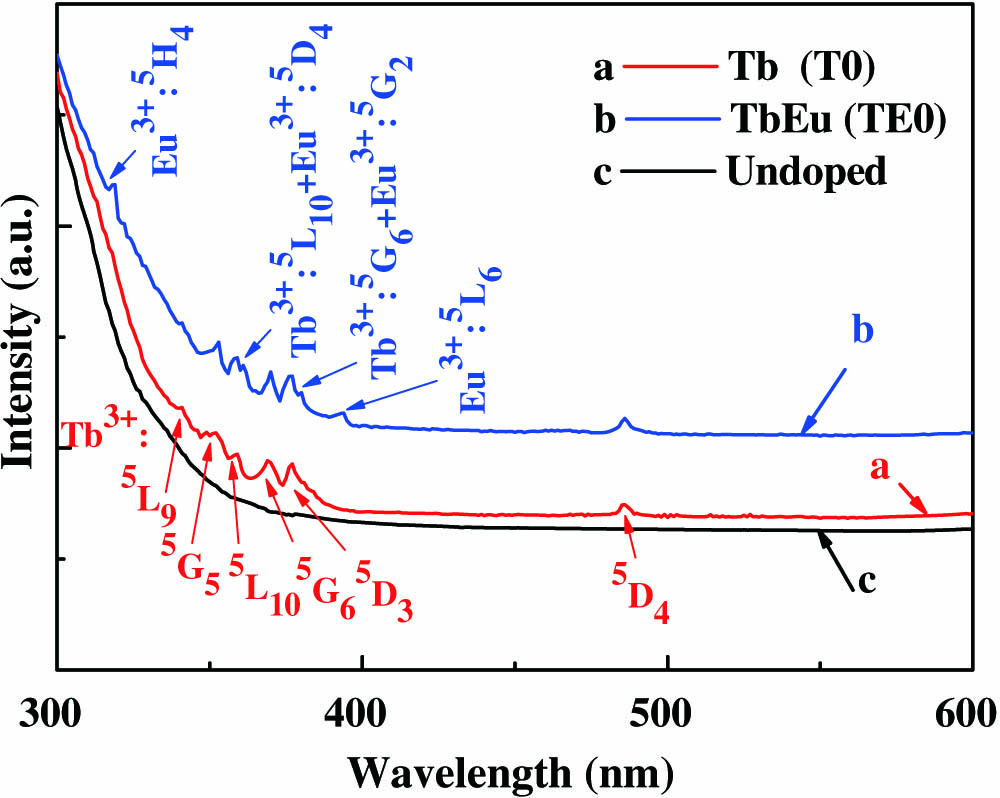
    Fig. 2. Absorption spectra of Samples T0 and TE0, and the un-doped crystals (marked a, b, and c, respectively).
    Emission spectra of Samples T0 and TE0 under 374 nm excitation.
    Fig. 3. Emission spectra of Samples T0 and TE0 under 374 nm excitation.
    Excitation spectra of Sample TE0 monitored at 487, 542, and 611 nm wavelengths.
    Fig. 4. Excitation spectra of Sample TE0 monitored at 487, 542, and 611 nm wavelengths.
    Emission spectra of Sample TE0 under various excitation wavelengths (353, 362, 374, and 384 nm).
    Fig. 5. Emission spectra of Sample TE0 under various excitation wavelengths (353, 362, 374, and 384 nm).
    Emission spectra of various Tb3+/Eu3+ co-doped LiYF4 crystals under 384 nm excitation.
    Fig. 6. Emission spectra of various Tb3+/Eu3+ co-doped LiYF4 crystals under 384 nm excitation.
    CIE chromaticity coordinates diagram for Samples TEi (i=0–4) under 384 nm excitation.
    Fig. 7. CIE chromaticity coordinates diagram for Samples TEi (i=04) under 384 nm excitation.
    SymbolsT0TE0TE1TE2TE3TE4
    Tb0.850.840.951.101.111.11
    Eu00.600.600.610.750.90
    Table 1. Concentrations of Tb3+ and Eu3+ Ions in LiYF4 Single Crystalsa
     Luminous Parameters
    SamplesCIE(x,y)Tc (K)RaQa
    TE00.31300.337764417675
    TE10.30270.348069046860
    TE20.30510.357767136466
    TE30.31200.355563997067
    TE40.32420.338958787775
    Table 2. Luminous Parameters of Samples TEia
    Yongzhang Jiang, Haiping Xia, Shuo Yang, Jiazhong Zhang, Dongsheng Jiang, Cheng Wang, Zhigang Feng, Jian Zhang, Xuemei Gu, Jianli Zhang, Haochuan Jiang, Baojiu Chen. Luminescence of Tb3+/Eu3+ codoped LiYF4 single crystals under UV excitation for white-light LEDs[J]. Chinese Optics Letters, 2015, 13(7): 071601
    Download Citation