The absorption spectra, excitation spectra, and emission spectra of ions in single crystals synthesized by an improved Bridgman method are measured. The emission spectra of several bands, mainly located at blue (), yellowish green (), and red () wavelengths, are observed under excitation by UV light. An ideal white light emission as a result of simultaneous combination of these emissions can be obtained from 1.11 mol%
Recently, a significantly increasing interest has been drawn from rare-earth (RE) ion doped single-host full-color emitting solid state materials for achieving white light emission because they show superior properties such as high heat resistance, high luminous efficiency, low light scattering, and low power consumption which could overcome the weaknesses of using the common two commonly used methods to obtain white LEDs[1–3].
So far, a lot of work has been carried out on the possible application of RE ions such as , , , and doped transparent solid-state materials in white LEDs[4–8]. As is well-known, under UV light excitation, ions have transitions in the blue light region () and yellowish-green light region (), while ions can emit red light ()[9–12]. These full-color emissions including blue-, green-, and red-emitting light could potentially enable a near-ideal white light. ions co-doped glasses have been fabricated and white emitting light was obtained[10,12].
Besides the dopants of REs, the host material also plays a significant role in LED applications. Previous LED materials mainly focused on glasses[6,7], glass ceramics[4,5], and transparent ceramics[8]. Single crystals can be considered to be very favorable as the host materials for optical devices because they have high luminous efficiency, high mechanical strength, and excellent chemical durability. Recently, we prepared single crystals co-doped with , and for a white light emission[3,13]. The single crystals have advantages of excellent thermal and mechanical properties, better transmittance, superior radiation resistance, as well as higher luminous efficiency. However, there are only a few reports about co-doped single crystals for white LED applications. In this Letter, a single crystal co-doped with was obtained by the modified Bridgman method, and the luminescence properties of the crystal were characterized, aimed at using it as a new potential host material for white LED applications.
Sign up for Chinese Optics Letters TOC. Get the latest issue of Chinese Optics Letters delivered right to you!Sign up now
single crystals doped with and co-doped with were successfully synthesized by a vertical Bridgman method. High-purity LiF, , , and as feed materials without any preprocessing were prepared for crystals growth. The Li-rich composition could be beneficial for the growth of these transparent crystals. The molar composition of the single crystals was determined by the formulas and (, 0.010, 0.011, 0.011, and 0.011; , 0.008, 0.008, 0.010, and 0.012, respectively). Then the as-prepared mixture of raw materials was ground in a mortar. The moisture and the some oxygen impurities in the fluoride powders were removed completely using the high-temperature hydrofluorination method by which the powders were sintered with anhydrous HF at 800°C for 8 h. The as-produced polycrystalline bars were fully ground in a mortar again and sealed in Pt crucibles sized . A detailed procedure for single crystals was described elsewhere[14]. The as-grown crystals were cut into several pieces and then well-polished to thickness. The samples are very transparent and one of them (TE0) is shown in the inset of Fig. 1.
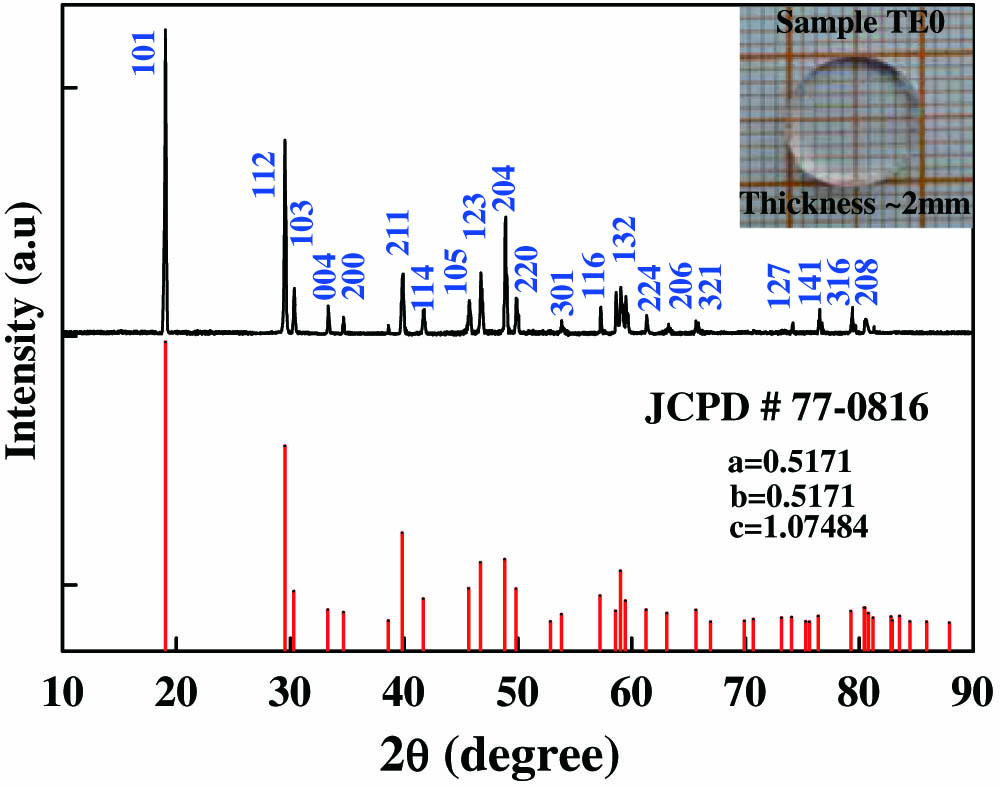
Figure 1.Powder XRD pattern of co-doped crystal (TE0). The standard pattern of the crystal is shown. Inset, single crystal (TE0).
The concentrations of the active ions in the samples were measured by inductively coupled plasma–atomic emission spectroscopy (ICP–AES, PerkinElmer Inc., Optima 3000) and the designated symbols for these samples and doping concentrations of rare earths are listed in Table 1. An XD-98X diffractometer (XD-3) was used to identify the phase composition of the single crystal. The absorption spectra ranging from 300 to 600 nm were recorded with a Cary 5000 UV/visible/near-IR (NIR) spectrophotometer (Agilent). The luminescence properties of the crystals were characterized by the excitation and emission spectra measured on an F-4500 spectrophotometer (Hitachi High-Technologies). All measurements were executed at room temperature (RT).
Symbols
T0
TE0
TE1
TE2
TE3
TE4
Tb
0.85
0.84
0.95
1.10
1.11
1.11
Eu
0
0.60
0.60
0.61
0.75
0.90
Table 1. Concentrations of Tb3+ and Eu3+ Ions in LiYF4 Single Crystalsa
Figure 1 displays the powder x-ray diffraction (XRD) pattern of the sample TE0 and the standard pattern of the crystal (Joint Committee on Powder Diffraction (JCPD) No. 77-0816)[15]. The corresponding lattice plane indexes are also labeled in Fig. 1. The diffraction peaks of single crystals co-doped with correspond well to those of standard and have no visible shift compared with standard card JCPD No. 77-0816, indicating that the obtained doped crystal has a pure phase. The other samples also showed similar XRD patterns. It proves that small amount of dopants substituting the positions of ions do not cause any meaningful change of the crystal structure. It also could be obtained that the sample TE0 has the scheelite () structure and its lattice constants can be calculated as follows where is the diffraction angle in corresponding lattice plane indexes , which have been marked in Fig. 1. is the Cu radiation wavelength (), and a, b, and c are the lattice constants.
The results are as follows: , and , which is very close to the standard constants (, and ) shown in Fig. 1.
Figure 2 displays the absorption spectra of Samples T0, TE0, and un-doped crystals which are marked a, b, and c, respectively, ranging from 300 to 600 nm. Obviously, an un-doped single crystal has no visible absorption peaks. It can be seen that at the singly doped T0 sample, the main absorption peaks are at , , , , and , which correspond to transitions from the ground state to the , , , , and excited states. With respect to the co-doped TE0 sample, obviously additional peaks at and , which are ascribed to the ion transitions from the to the and excited states, appeared. All the corresponding transitions have been clearly marked in Fig. 2. The absorption spectrum of Sample TE0 shows that the crystal co-doped with ions can be excited simultaneously efficiently by UV light.
Figure 2.Absorption spectra of Samples T0 and TE0, and the un-doped crystals (marked a, b, and c, respectively).
In order to investigate the luminescence properties of a co-doped single crystal, the emission spectra of Samples T0 and TE0 under 374 nm excitation were measured and are displayed in Fig. 3. As shown in Fig. 3, the crystal TE0 can emit blue light around 413 and 436 nm, corresponding to (, 4) transitions of ; a green–blue light near 487 nm, due to the electronic transition of (); a green light near 542 nm (); an orange light near 587 nm, which originates from the co-contribution of and due to the overlapped emissions corresponding to the transition of ions and the transition of ions; and a red light near 611 and 618 nm, ascribed to the transitions of () and () ions, respectively. All the transitions are labeled clearly in Fig. 3. The simultaneous emissions of blue, green, and red light enable white light to be possible from co-doped crystals pumped by UV light.
Figure 3.Emission spectra of Samples T0 and TE0 under 374 nm excitation.
Figure 4 presents the excitation spectra of Sample TE0 monitored at 487, 542, and 611 nm wavelengths ranging from 300 to 400 nm for obtaining an optimal excitation wavelength. The monitored spectra are named d, e, and f in Fig. 4, correspondingly. It can be obviously found that the intensity of the excitation peaks for Curve e is slightly stronger than that for Curve d. It indicates that the intensity of the emission peak at 542 nm is slightly stronger than that at 487 nm when excited by corresponding excitation wavelengths. The excitation spectrum for Curve f shows similar characteristic bands of ions centering at 306, 318, 360, 380, and 394 nm, and its corresponding electronic transitions from the ground state to excited states , , , , and , respectively. Four excitation bands peaking at 302 (), 318 (, ), 353 (, , , , , ), and 374 nm (, ) are included in the excitation spectrum of for Curve d. Moreover, Curve e shows the similar excitation spectrum to Curve d. As shown in Fig. 4, the excitation wavelengths at 353, 362, 374, and 384 nm were chosen to obtain a better white light emission. Figure 5 shows the emission spectra of Sample TE0 ranging from 400 to 760 nm under the excitation wavelengths 353, 362, 374, and 384 nm, respectively. When excited by those wavelengths, the emission spectra show similar bands while the luminous intensities are changed with the excitation wavelengths. The related electronic transitions have been discussed previously in the context of Fig. 3.
Figure 4.Excitation spectra of Sample TE0 monitored at 487, 542, and 611 nm wavelengths.
The different concentrations of dopants in single crystals were prepared for obtaining an optimum white light emission. Figure 6 displays the fluorescence spectra of the samples () under 384 nm excitation wavelength. It can be clearly found that the emission peaks of the samples are similar with a slight difference in luminous intensities. One can state that emission intensities change with concentrations of and ions in single crystals. This luminous phenomenon implies a complicated process of energy transition between the and ions in the host material[12].
Figure 6.Emission spectra of various co-doped crystals under 384 nm excitation.
It is necessary to mark chromaticity coordinates of the samples on a standard chromaticity diagram for reflecting their luminescence color which is shown in Fig. 7. The chromaticity coordinates for the emissions of the samples () under 384 nm excitation wavelengths can be calculated using the following[16]where , , and are three tristimulus values. Those three values are given by the following[16]where is the wavelength of the equivalent monochromatic light. is the spectral power distribution, which is the input for tristimulus values and its data are shown in Fig. 6. , , and are the three color-matching functions.
Figure 7.CIE chromaticity coordinates diagram for Samples () under 384 nm excitation.
Color temperature () is also a key technical factor for evaluating the applicability of a luminescence material. It can be estimated using McCamy’s equation where , , and are the spectral matching stimulus which can be calculated by Matrix where , , and are three tristimulus values which can be calculated as per Eqs. (2) and (3).
The color render index () and color quality scale () are widely used for assessing the luminescence performance of a light source. Thus, introduction of these parameters is good for investigating the luminescence performance of the samples’ (). Detailed procedures for the calculation of and are available in Refs. [17,18]. The final calculations for these are provided as follows where is the difference in color appearance for each sample between illumination by the test source and the reference illuminant which can be computed in Commission Internationale de L’Eclairage (CIE) uniform color space where is the rms of the 15 color differences for each sample illuminated by the test source and reference illuminant. Note that the can be calculated by using Eq. (7) when the correlated color temperature of the test light source is greater than 3500 K.
The chromaticity coordinates of the () under 384 nm excitation were calculated using Eq. (2) and are marked in a chromaticity diagram as shown in Fig. 7. It can be seen that emission intensities of the samples are all in the white light region, and the emission of Sample TE4 is much closer to the standard equal energy white light illumination (, ). To further understand the luminous characteristic of these samples, the luminous parameters, including chromaticity coordinates, color temperature (), color rendering index (), and color quality scale (), which were calculated using Eqs. (2)–(7), are listed in Table 2. Although the luminous properties of these samples fall into the white light region, more effort should focus on decreasing the color temperature and increase the color quality scale of co-doped crystals, which is relegated to future work.
In conclusion, single crystals co-doped with for LEDs are obtained by a modified Bridgman method. It shows better luminescent properties from the emission spectra including synchronously blue, green, and red light bands. This work proves that white light emission from crystals co-doped with ions can be achieved under a proper excitation wavelength. Furthermore, all the results indicate that the emission light color can be tuned for different demands by varying the excitation wavelengths or adjusting the concentrations of ions in single crystals. Due to excellent advantages of white light-emitting crystals, crystals co-doped with ions might have broad application prospects for white light emission.