
Jianyan Du, Yiqiang Zhao, Mao Ye, Yuanqi Lin, Xiaoxiao Zheng. Study on Driving Circuit of Narrow Pulse Width and Large Current Semiconductor Laser[J]. Laser & Optoelectronics Progress, 2022, 59(1): 0114008
- Laser & Optoelectronics Progress
- Vol. 59, Issue 1, 0114008 (2022)
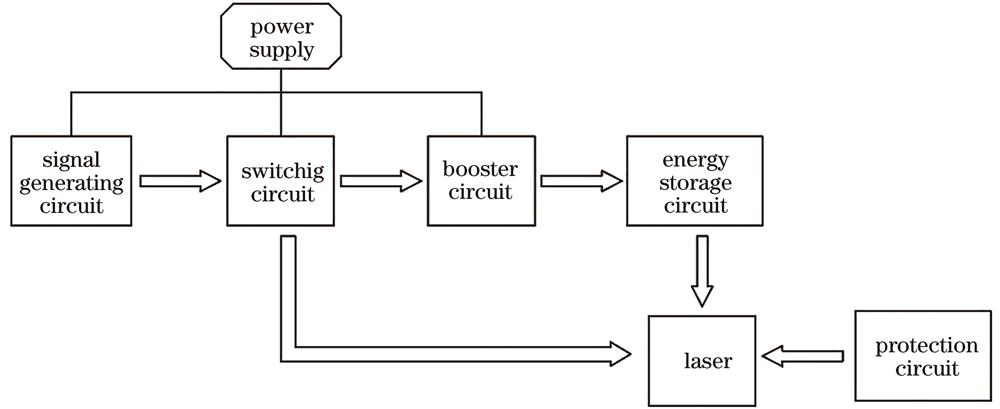
Fig. 1. System block diagram of drive circuit
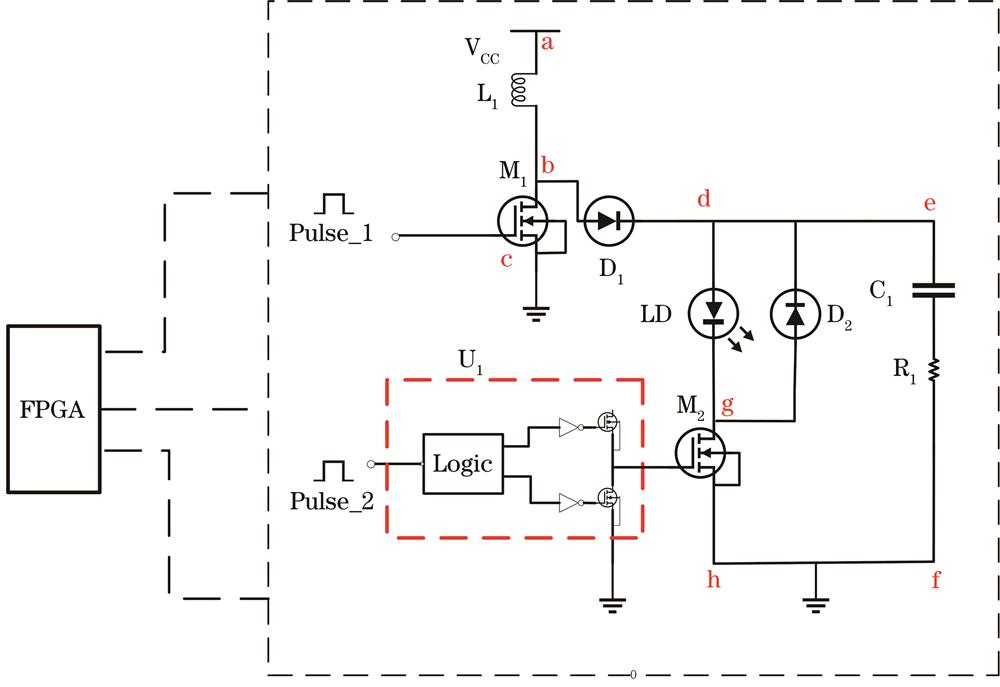
Fig. 2. Principle structure of driving circuit
Fig. 3. Inductance current discontinuous operation mode
Fig. 4. Inductance analysis. (a) Relationship between inductance charging time and inductance; (b) relationship between switching power consumption and drain current and conduction time
Fig. 5. Relationship between inductance and induced electromotive force
Fig. 6. Discharge circuit simulation under different conditions of output current pulse. (a) Under different capacitances; (b) under different load resistances; (c) under different parasitic inductors; (d) current pulse of discharge circuit
Fig. 7. Inductive current and capacitance high voltage waveform
Fig. 8. Experimental results of driving signals. (a) Drive signal; (b) signal rising edge
Fig. 9. Experimental test. (a) Test platform; (b) output pulse waveform of semiconductor laser
Fig. 10. Relationship between output peak current and time when driving circuit works for 3 h
|
Table 1. Classification and comparison according to different inductance cores
|
Table 2. Specific parameters of power inductor
|
Table 3. Simulation and experimental comparison results

Set citation alerts for the article
Please enter your email address
© Copyright 2018-2021 | Chinese Laser Press. All Rights Reserved 沪ICP备15018463号-20