
Keyan Chen, Qiaohong Liu, Xiaoxiang Han, Yuanjie Lin, Weikun Zhang. Cardiac Image Segmentation by Combining Frequency Domain Prior and Feature Enhancement[J]. Laser & Optoelectronics Progress, 2024, 61(10): 1037005
- Laser & Optoelectronics Progress
- Vol. 61, Issue 10, 1037005 (2024)
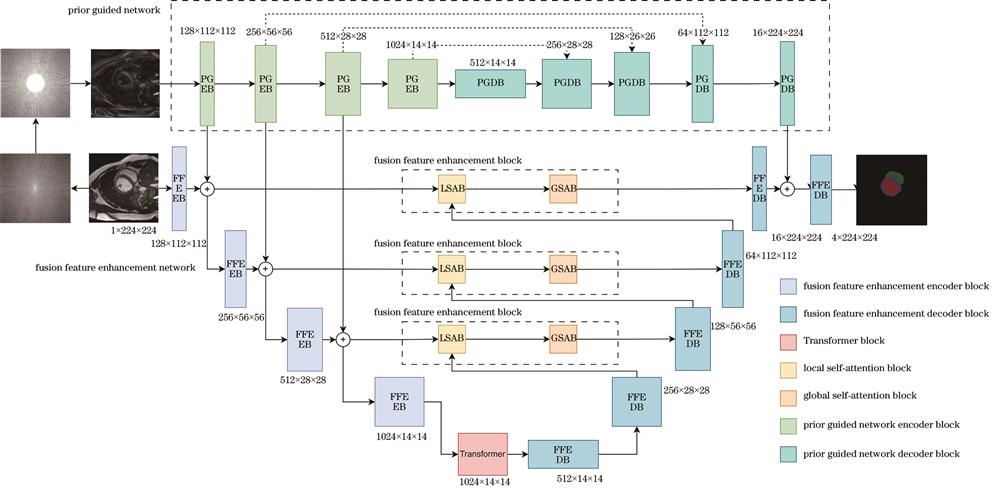
Fig. 1. DNet model structure

Fig. 2. Upsampling process. (a) Before sampling; (b) after sampling
Fig. 3. Local self-attention block
Fig. 4. Global self-attention block
Fig. 5. Prior guidance information extraction process
Fig. 6. Comparison of segmentation results
Fig. 7. Feature heatmaps before and after fusion
Fig. 8. Feature heatmaps before and after fusion
| ||||||||||||||||||||||||||||||||||||||||||||||||||||
Table 1. Comparison of segmentation effects of different methods on ACDC dataset
|
Table 2. Comparison of segmentation effects of different prior guided strategies
|
Table 3. Comparison of segmentation effects of different feature fusion enhancement strategies
|
Table 4. Results of ablation experiments
|
Table 5. Results of prior feature concatenation
|
Table 6. Results of using local and global attention individually and in combination
|
Table 7. Results of using different mask shapes
|
Table 8. Results of different mask radii

Set citation alerts for the article
Please enter your email address
© Copyright 2018-2021 | Chinese Laser Press. All Rights Reserved 沪ICP备15018463号-20