• NUCLEAR TECHNIQUES
  • Vol. 47, Issue 1, 010003 (2024)
Chunxin WANG1,2, Anchuan FAN1,2,*, Bo LI3,**, Zihan YAN1,2, and Xiaolei ZHANG4
Author Affiliations
  • 1USTC Archaeometry Laboratory, University of Science and Technology of China, Hefei 230026, China
  • 2Department for the History of Science and Scientific Archaeology, University of Science and Technology of China, Hefei 230026, China
  • 3Centre for Archaeological Science, School of Earth, Atmospheric and Life Sciences, University of Wollongong, Wollongong NSW 2522, Australia
  • 4Anhui Provincial Institute of Cultural Relics and Archaeology, Hefei 230601, China
  • show less
    DOI: 10.11889/j.0253-3219.2024.hjs.47.010003 Cite this Article
    Chunxin WANG, Anchuan FAN, Bo LI, Zihan YAN, Xiaolei ZHANG. Luminescence spectrum characteristics and dating studies of archaeologically heated quartz[J]. NUCLEAR TECHNIQUES, 2024, 47(1): 010003 Copy Citation Text show less
    (a) Illustration of luminescence energy band model, (b) illustration of wavelength distribution of luminescence spectrum of quartz
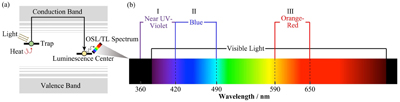
    Fig. 1. (a) Illustration of luminescence energy band model, (b) illustration of wavelength distribution of luminescence spectrum of quartz
    (a) Configuration of Risø DA-20 luminescence dating instrument with Andor spectrometer, (b) three different types of detection modules, (c) automated detection filter changer, (d) detection filters
    Fig. 2. (a) Configuration of Risø DA-20 luminescence dating instrument with Andor spectrometer, (b) three different types of detection modules, (c) automated detection filter changer, (d) detection filters
    (a) Thermoluminescence spectrum of Risø source calibration quartz, (b) thermoluminescence spectrum of Lingjiatan pottery quartz (color online)
    Fig. 3. (a) Thermoluminescence spectrum of Risø source calibration quartz, (b) thermoluminescence spectrum of Lingjiatan pottery quartz (color online)
    (a) Transmittance of different filter combinations and quantum efficiencies of different PMTs, (b) sensitivity signal of archaeological pottery quartz thermoluminescence for different filter and PMT combinations, (c) isothermal thermoluminescence sensitivity signal of archaeological pottery quartz with different filter and PMT combinations
    Fig. 4. (a) Transmittance of different filter combinations and quantum efficiencies of different PMTs, (b) sensitivity signal of archaeological pottery quartz thermoluminescence for different filter and PMT combinations, (c) isothermal thermoluminescence sensitivity signal of archaeological pottery quartz with different filter and PMT combinations
    Thermoluminescence curves and peaks for Blue TL (a) and Red TL (b), fitted using a general-order empirical expression
    Fig. 5. Thermoluminescence curves and peaks for Blue TL (a) and Red TL (b), fitted using a general-order empirical expression
    (a) The Blue TL curve and the trend of 290~325 °C TL signal integral with exposure time, (b) the Red TL curve and the trend of 340~375 °C TL signal integral with exposure time
    Fig. 6. (a) The Blue TL curve and the trend of 290~325 °C TL signal integral with exposure time, (b) the Red TL curve and the trend of 340~375 °C TL signal integral with exposure time
    (a, c) The heated plateau and De plateau test results for Blue TL-SAR, respectively, establishing the integration interval of 290~325 °C for Blue TL-SAR. In contrast, (b, d) the heated plateau and De plateau test results for Red TL-SAR, determining the interval at 340~375 °C for Red TL-SAR
    Fig. 7. (a, c) The heated plateau and De plateau test results for Blue TL-SAR, respectively, establishing the integration interval of 290~325 °C for Blue TL-SAR. In contrast, (b, d) the heated plateau and De plateau test results for Red TL-SAR, determining the interval at 340~375 °C for Red TL-SAR
    The dose recovery test results for Blue TL-SAR (a), Red TL-SAR (b), Blue ITL-SAR (c), and Red ITL-SAR (d), respectively
    Fig. 8. The dose recovery test results for Blue TL-SAR (a), Red TL-SAR (b), Blue ITL-SAR (c), and Red ITL-SAR (d), respectively
    De radial plots of Blue TL-SAR (a), Red TL-SAR (b), Blue ITL-SAR (c), and Red ITL-SAR (d), respectively
    Fig. 9. De radial plots of Blue TL-SAR (a), Red TL-SAR (b), Blue ITL-SAR (c), and Red ITL-SAR (d), respectively
    Comparison of luminescence and radiocarbon ages
    Fig. 10. Comparison of luminescence and radiocarbon ages

    步骤

    Step

    蓝光或红光热释光单片再生法

    Blue/Red TL-SAR

    蓝光或红光等温热释光单片再生法

    Blue/Red ITL-SAR

    光释光单片再生法

    OSL-SAR

    信号

    Signal

    1自然/再生剂量,DiNatural/regenerative dose, Di自然/再生剂量,DiNatural/regenerative dose, Di自然/再生剂量,DiNatural/regenerative dose, Di
    2160 °C预热10 sPreheat at 160 °C for 10 sT+10 °C预热Cut-heat at T+10 °C for 0 s240 °C预热10 sPreheat at 240 °C for 10 s
    3热释光激发至450 °C (2 °C∙s-1)TL stimulated to 450 °C (2 °C∙s-1)T °C等温热释光激发ITL stimulated at T °C125 °C光释光激发OSL stimulated at 125 °CLx
    4试验剂量, DtTest dose, Dt试验剂量,DtTest dose, Dt试验剂量, DtTest dose, Dt
    5160 °C预热10 sPreheat at 160 °C for 10 sT+10 °C预热Cut-heat at T+10 °C for 0 s200 °C预热0 sCut-heat at 200 °C for 0 s
    6热释光激发至450 °C (2 °C∙s-1)TL stimulated to 450 °C (2 °C∙s-1)T °C等温热释光激发ITL stimulated at T °C125 °C光释光激发OSL stimulated at 125 °CTx
    7循环步骤1~6Repeat step 1~6循环步骤1~6Repeat step 1~6循环步骤1~6Repeat step 1~6
    Table 1. Luminescence dating methods

    动力学参数

    Parameters

    热释光峰1

    TL peak1

    热释光峰2

    TL peak2

    热释光峰3

    TL peak3

    蓝光热释光

    Blue TL

    红光热释光

    Red TL

    蓝光热释光

    Blue TL

    红光热释光

    Red TL

    蓝光热释光

    Blue TL

    红光热释光

    Red TL

    Tm / K502.64485.98586.34590.60652.74647.96
    Im / cts980.87665.201 812.262 297.90543.2311 294.48
    E / eV1.331.350.860.921.702.24
    b2.002.001.001.002.001.53
    s / s-12.82×10121.16×10131.35×1064.74×1062.12×10122.72×1016
    R1.161.520.971.01
    Table 2. Kinetic parameters determined by deconvolving Blue TL and Red TL using general-order empirical expression

    方法

    Method

    等效剂量Equivalent dose

    De / Gy

    过度分散值Overdispersion

    OD / %

    年代

    Age / ka

    Blue TL-SAR19.6±0.24.7±1.05.6±0.3
    Blue ITL-SAR19.4±0.512.6±2.05.5±0.3
    Red TL-SAR18.5±0.413.8±1.75.3±0.3
    Red ITL-SAR18.8±0.510.5±2.25.4±0.3
    OSL-SAR19.4±0.918.5±3.45.5±0.4
    Table 3. Comparison of ages of different luminescence dating methods
    Chunxin WANG, Anchuan FAN, Bo LI, Zihan YAN, Xiaolei ZHANG. Luminescence spectrum characteristics and dating studies of archaeologically heated quartz[J]. NUCLEAR TECHNIQUES, 2024, 47(1): 010003
    Download Citation