
Zhenhong DU, Sensen WU, Zhongyi WANG, Yuanyuan WANG, Feng ZHANG, Renyi LIU. Estimating Ground-Level PM2.5 Concentrations Across China Using Geographically Neural Network Weighted Regression [J]. Journal of Geo-information Science, 2020, 22(1): 122
- Journal of Geo-information Science
- Vol. 22, Issue 1, 122 (2020)
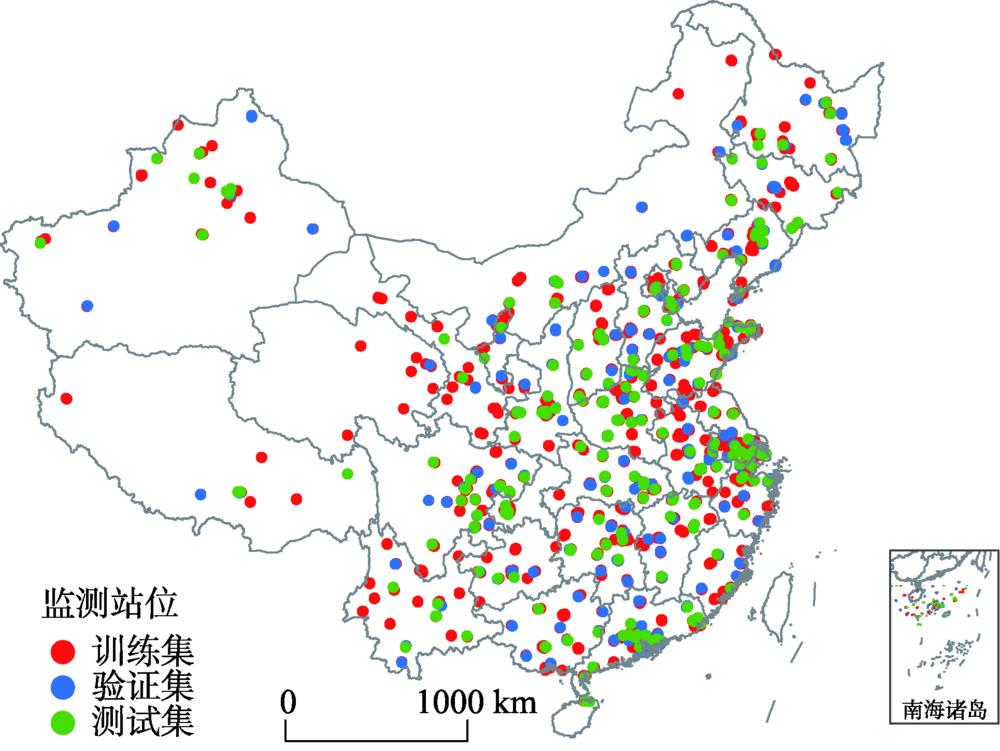
Fig. 1. Spatial distribution of the PM2.5 monitoring stations of China in 2017 and the spatial partitions of the training, validation, and testing datasets
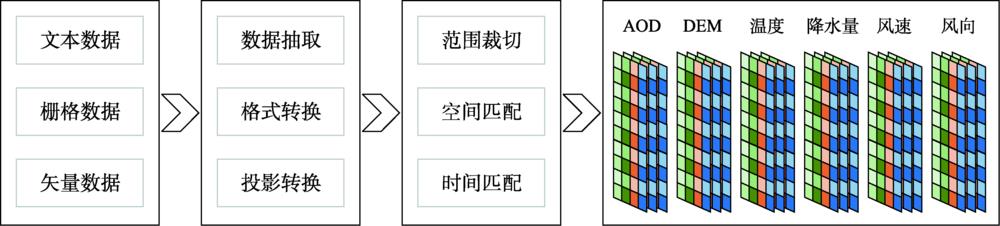
Fig. 2. Pre-processing of the experimental dataset
Fig. 3. Definition of the GNNWR model for PM2.5 estimation
Fig. 4. Structure design of the spatial weighted neural network
Fig. 5. Training and validation procedures of the GNNWR model
Fig. 6. Performance variations for the training and validation datasets of the GNNWR model
Fig. 7. Estimates of the annual mean PM2.5 across China in 2017
Fig. 8. Details comparison of the annual mean PM2.5 estimates between the GWR and GNNWR models
Fig. 9. Spatial distribution of absolute estimation errors of the annual mean PM2.5 of China in 2017 for the OLR, GWR, and GNNWR models
|
Table 1. Data sources and description
| ||||||||||||||
Table 2. Settings of GWR models
|
Table 3. Settings of architectures and hyper-parameters for the GNNWR model
|
Table 4. Exploratory analysis and descriptive statistics of the experimental dataset across China in 2017
| ||||||||||||||||||||||||||||||||||||||||||||||||||||||||||||||||||||||||||||
Table 5. Fitting and prediction performances of the PM2.5 estimates for the OLR, GWR, and GNNWR models
| ||||||||||||||||||||||||||||||||||||||||||||||||||||||||||||||||||||||||
Table 6. Spatial nonstationarity diagnosis of each variable in the GNNWR model

Set citation alerts for the article
Please enter your email address
© Copyright 2018-2021 | Chinese Laser Press. All Rights Reserved 沪ICP备15018463号-20