• Acta Optica Sinica
  • Vol. 44, Issue 2, 0212003 (2024)
Yaodeng Liu1, Lü Yaowen1、*, Bojun Du2, Xuanrui Gong1, and Xi Huang1
Author Affiliations
  • 1Key Laboratory of Optoelectronic Measurement and Control and Optical Information Transmission Technology, Ministry of Education, School of Electro-Optical Engineering, Changchun University of Science and Technology, Changchun 130013, Jilin , China
  • 2Unit 63850 of the People's Liberation Army, Baicheng 137001, Jilin , China
  • show less
    DOI: 10.3788/AOS231284 Cite this Article Set citation alerts
    Yaodeng Liu, Lü Yaowen, Bojun Du, Xuanrui Gong, Xi Huang. Projection Center and Triple Difference Detection Method of T-Type Photoelectric Theodolite[J]. Acta Optica Sinica, 2024, 44(2): 0212003 Copy Citation Text show less
    Coordinate systems and imaging model. (a) Relation among three coordinate systems; (b) pinhole imaging model
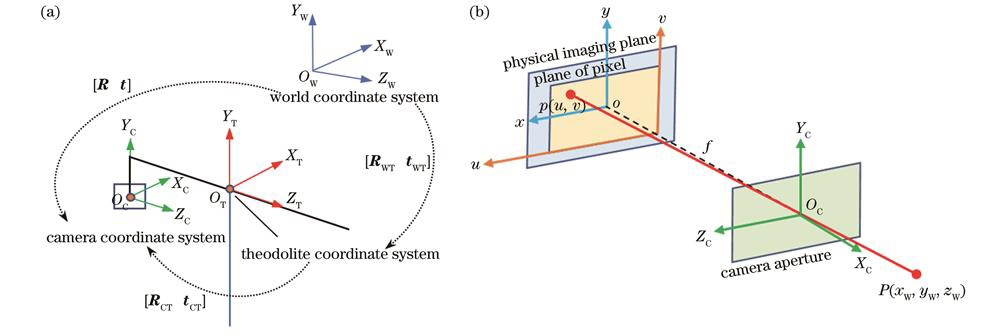
    Fig. 1. Coordinate systems and imaging model. (a) Relation among three coordinate systems; (b) pinhole imaging model
    T-type photoelectric theodolite imaging model. (a) Positive image; (b) inverted image
    Fig. 2. T-type photoelectric theodolite imaging model. (a) Positive image; (b) inverted image
    T-type photoelectric theodolite for pole vertex imaging diagram. (a) Positive image; (b) reversed image
    Fig. 3. T-type photoelectric theodolite for pole vertex imaging diagram. (a) Positive image; (b) reversed image
    Flow chart of proposed overall algorithm
    Fig. 4. Flow chart of proposed overall algorithm
    Performance with noise level on detection accuracy. (a) tz, ty; (b) g, h, cx, cy
    Fig. 5. Performance with noise level on detection accuracy. (a) tz, ty; (b) g, h, cx, cy
    Performance with tx on detection accuracy. (a) tz, ty; (b) g, h, cx, cy
    Fig. 6. Performance with tx on detection accuracy. (a) tz, ty; (b) g, h, cx, cy
    Performance with near station pole distance on detection accuracy. (a) tz, ty; (b) g, h, cx, cy
    Fig. 7. Performance with near station pole distance on detection accuracy. (a) tz, ty; (b) g, h, cx, cy
    Picture of T-type photoelectric theodolite
    Fig. 8. Picture of T-type photoelectric theodolite
    Captured images of station poles. (a) Near station pole under positive image; (b) near station pole under reversed image; (c) far station pole under positive image; (d) far station pole under reversed image
    Fig. 9. Captured images of station poles. (a) Near station pole under positive image; (b) near station pole under reversed image; (c) far station pole under positive image; (d) far station pole under reversed image
    Reprojection error distribution. (a) Before optimization; (b) after optimization
    Fig. 10. Reprojection error distribution. (a) Before optimization; (b) after optimization
    Parameterty /mtz /mg /(°)cx /(°)h /(°)cy /(°)
    Linear computed value0.01450.14500.37650.27650.01910.0346
    Optimized value0.01430.14440.37710.27560.01830.0351
    Table 1. Comparison of linear calculation values and optimized values
    Yaodeng Liu, Lü Yaowen, Bojun Du, Xuanrui Gong, Xi Huang. Projection Center and Triple Difference Detection Method of T-Type Photoelectric Theodolite[J]. Acta Optica Sinica, 2024, 44(2): 0212003
    Download Citation