Xu WANG, Cheng-Xiang TU, Liang ZHANG, Jian-Yu WANG. Analysis and verification of the positioning accuracy of a flat-panel detector used for precision pointing in space optical communication[J]. Journal of Infrared and Millimeter Waves, 2022, 41(3): 631
Copy Citation Text
To realize a high-precision link in space optical communication, we analyzed key factors that affect the accuracy of flat-panel detectors in terms of target positioning. The error of the centroid algorithm was analyzed from the mechanism and the necessity of satisfying the spatial lossless sampling condition was verified by using a simulation. The defined NU value served as an indicator in quantifying the nonuniformity of the detector. As the NU value increased linearly, the positioning error of the centroid continued to increase, whereas the speed reduced. When the NU value was 0.005, the maximum positioning error was 0.043 pixels. Considering that the light intensity of the target incident on the optical system varies constantly, the smaller the NU value, the closer the centroid is to the true position of the light spot. Furthermore, the pixel response of a typical complementary metal oxide semiconductor (CMOS) detector was experimentally tested under different illumination intensities. Based on the response curve, a mathematical model for the nonuniformity of the pixel response was established. It can be determined that the NU value fluctuates from 0.0045 to 0.0048 within the linear response range. The experimental results of the spot centroid positioning accuracy verify that the absolute positioning error is less than 0.05 pixels, which satisfies the requirements of high-precision links. Therefore, the effectiveness of the theory and simulation presented in this study can be validated.
Owing to several advantages,such as high speed,minimal terminal size requirements,and strong confidentiality,space optical communication has developed substantially in recent years [1]. The acquisition,tracking,and pointing(ATP)technology is essential in space optical communication. Herein,“pointing” refers to the accurate transmission of a communication signal from a terminal to a receiving aperture based on accurate tracking. The centroid positioning accuracy in the target detection process is a key factor in determining the pointing accuracy;therefore,accurate centroid estimation is highly essential for free-space optical communication[2]. The ATP system currently used in space optical communications primarily uses three types of optical detectors [3],namely the four-quadrant detectors,charge-coupled device(CCD)detectors,and complementary metal oxide semiconductor(CMOS)detectors. Among these,CCD and CMOS detectors are flat-panel detectors. A detector-based camera detects the direction of the beacon light in the optical communication link to obtain information on the position of the communication terminal using the ATP system [4]. The precision tracking detectors carried by Japan’s ETS-VI satellite [5] and OICETS satellite [6] used four-quadrant detectors,and the pointing errors were more than 1 μrad. Although laser communication is realized in space,the angular detection linearity of the four-quadrant detector is poor with a small field of view(FOV)and a large blind area of the pixel. Moreover,the beacon spot shape in the fine tracking stage cannot be monitored and obtained in real-time. To suppress the pointing error and realize a pointing link that satisfies the accuracy requirements,an effective aiming mechanism needs to be configured [7],which increases the complexity of the system [8]. Unlike the four-quadrant detector,a flat-panel detector exhibits a larger detection front with higher pixel uniformity and detection accuracy. This implies that it can satisfy the needs of a large FOV of the coarse tracking detection camera in the ATP system and achieve the required high frame rate of the precision tracking detection camera. Therefore,it can be potentially applied to long-distance space optical communication[9]. Furthermore,cameras based on CMOS flat-panel detectors can solve the problems of advanced aiming angle and deviations of the light-receiving and light-emitting axes by changing the precise tracking point method. This method does not require an advanced aiming mechanism and can detect the pointing angle in real-time. Moreover,it has been verified in the in-orbit experiment of the quantum science experimental satellite Micius [10].
As accurate positioning of the target spot is essential for the detector in the space optical communication terminal,several researchers have explored this concept in recent years. A method was proposed to obtain the optical flow vector using image data considering the effect of background noise on a beacon in inter-satellite optical communication [11]. Another study compared the performance of the maximum likelihood algorithm with that of the centroid algorithm [12] and determined that the computational complexity of the centroid algorithm is substantially lower than that of the maximum likelihood estimation. When signal-to-noise ratio(SNR)was low,the maximum likelihood estimation performance had a smaller mean square error,whereas the overall performance of the centroid algorithm was better at high SNR. Furthermore,a method based on the star sensor technique and Kalman filter(KF)was proposed [13],which recognized and tracked targets under a certain level of background noise. In another study,the researchers combined the modulation transfer function of the star sensor optical system and pixel frequency response characteristics of the image sensor,analyzed the star point image generated by the star sensor,and proposed a star sensor centroid localization algorithm based on the star image resampling [14]. Another study considered various random factors that influence spot detection and established a noise equivalent angle(NEA)model for centroid localization [15]. This model did not depend on the point spread function of the target signals,and it simulated the influence of different factors on the NEA.
However,the aforementioned studies are based on the assumption of the specific application backgrounds,focusing on methods to reduce errors in a certain aspect to improve the precision of detection. The factors that affect spot positioning have not been systematically analyzed from a global perspective. Moreover,the accuracy of point target positioning in the case of precise pointing in space optical communication has not been considered thus far. Precision is a prerequisite for ensuring accuracy because high precision does not necessarily result in high accuracy. Therefore,it is necessary to investigate the accuracy of the detector used in the optical communication terminal for target positioning.
The remainder of this paper is organized as follows. Section 1 systematically analyzes the factors that affect the positioning accuracy of the flat-panel detector in a communication terminal. Section 2 investigates the error of the centroid algorithm from the mechanism and verifies the necessity of satisfying the spatial lossless sampling condition using a simulation. In Section 3,we set the quantitative index of detector nonuniformity,quantitatively simulate the relationship between nonuniformity and positioning error,and propose correction algorithms. Section 4 presents the tested typical CMOS detector,which was used to establish a mathematical model for the nonuniformity of the pixel response and measure the positioning accuracy of the spot centroid. Section 5 discusses and summarizes the results.
1 Factors affecting the target positioning accuracy
The image data collected by the flat-panel detector in the communication terminal were post-processed,and the centroid of the light spot was extracted to obtain the position of the target. The closeness of the centroid measurement value of the target to the true value indicates the positioning accuracy. The general term used for the accuracy and precision of the measurement is target positioning accuracy. Various factors,such as the optical system at the front end of the detector,performance of the detector,circuit system around the detector,and algorithm for calculating the position of the center of mass,impact the accuracy of target positioning.
The positioning error of the target spot can be classified into two,namely systematic error and random error [16]. Random errors primarily occur owing to various noises in the imaging process,such as readout noise,dark current noise and shot noise. The influence of random error on centroid positioning can be expressed using the NEA,which can be obtained based on the NEA model of the centroid positioning of point targets in space optical communication [15].
,
where N represents the half-width of the centroid spot size,wherein the widths of the centroid spot in the horizontal and ordinate directions are 2N+1;S indicates the intensity of the target signal;and denotes noise. Considering the distribution characteristics of the noise signal,it can be expressed as:
,
where represents the shot noise of the pixel with coordinates , denotes the readout noise,and indicates the dark current noise. Shot noise is classified as a type of Poisson distributed noise based on the form of energy distribution,whereas dark current and readout noises are classified as Gaussian distributed noise.
Poisson noise is a type of signal-dependent noise,which increases with the enhancement of the signal. Here,the average photon noise equals the square root of the number of incident photons. Gaussian noise is a type of additive white noise generated by the random thermal movement of electrons in photosensitive devices. Typically,the average level of Gaussian noise is retained irrespective of the light intensity. Therefore,the dark field image correction and multi-image single-pixel time-domain average processing can generally suppress random errors[17].
As random errors can be suppressed effectively,systematic errors are the primary errors that affect the positioning accuracy of the target spot. These include the error caused by the inherent nonuniformity of the flat-panel detector and the error generated by using the geometric center of the pixel rather than the true energy center of the pixel in the centroid algorithm. The former affects the sampling process of the spot in the flat-panel detector and distorts the image,whereas the latter affects the calculation of the target position.
2 Error analysis and control of the centroid algorithm
2.1 Error analysis of the centroid algorithm
The optical system in space optical communication is equivalent to the Fraunhofer diffraction system. Therefore,the beacon spot that converges on the flat-panel detector is a diffracted spot with a diameter approximately equal to the Airy disk diameter of the optical system;the energy can be regarded as a Gaussian distribution. The actual centroid position of the target spot on the terminal detector,which is equivalent to the energy center of the image plane,can be expressed as
,
where x and y denote the horizontal and vertical coordinates on the image plane of the flat-panel detector,respectively;S indicates the spatial area occupied by the target spot;and represents the light intensity distribution function of the beacon spot on the detector plane. Equation(3) expresses the centroid algorithm,which is a continuous integral in the space domain. However,the spot image obtained from the flat-panel detector is the sampling value of at the pixel position owing to its finite size. Therefore,the calculated spot centroid position is ,which can be expressed as
,
where A denotes the number of pixels in the detector, indicates the geometric center coordinates of the pixels in the detector,and represents the sampling value of the light intensity distribution function of the kth effective pixel. As the pixel size of the detector cannot be infinitely small,the geometric center of the spot calculated using(4)cannot completely coincide with the energy center of the spot. Consequently,a systematic error occurs when the detector uses the centroid algorithm to locate the spot.
2.2 Error control of the centroid algorithm
Using a flat-panel detector with a pixel interval of d to sample the spatial energy distribution of the diffracted spot results in a type of discrete sampling at equal intervals. To prevent the overlap of the sampled distributions and recover the energy distribution information of the original spot completely,the spatial sampling frequency 1/d of the detector must be greater than the spatial cut-off frequency of the modulation transfer function of the optical combination lens [18].
,
Equation(5) is the theoretical basis for eliminating the error from the algorithm in the process of centroid positioning,where λ denotes the wavelength of the beacon light,f indicates the combined focal length of the detection system,and D represents the effective aperture of the detection system.
According to(5),the range of the diffracted spot diameter on the flat-panel detector can be deduced considering that the theoretical lossless sampling law is satisfied. As is approximately equal to the diameter of the Airy disk of the optical system,
,
combining(5)and(6)to obtain
.
Equation(7) validates that the spatial lossless sampling condition of the flat-panel detector can be satisfied when the spot diameter is greater than 2.44 pixels. In practical applications,the light spot needs to cover at least 3 × 3 pixels.
2.3 Simulation
Considering the aforementioned conclusions(section 2.2),we performed a normalized simulation. Assuming that the detector is ideal for spot sampling and the point spread function of the optical system follows an ideal Gaussian distribution,the X- and Y-axis directions are consistent during the positioning of the target spot. Therefore,the positioning process only needs to be analyzed in the direction of the X-axis. The center of mass of the spot with as the energy center after convolution,sampling,and calculation is denoted as [19].
,
where indicates the frequency domain representation of the received energy function of the pixel, denotes the frequency,and 1/d represents the spatial sampling frequency of the detector. When the Gaussian radius of the point spread function is , can be expressed as
.
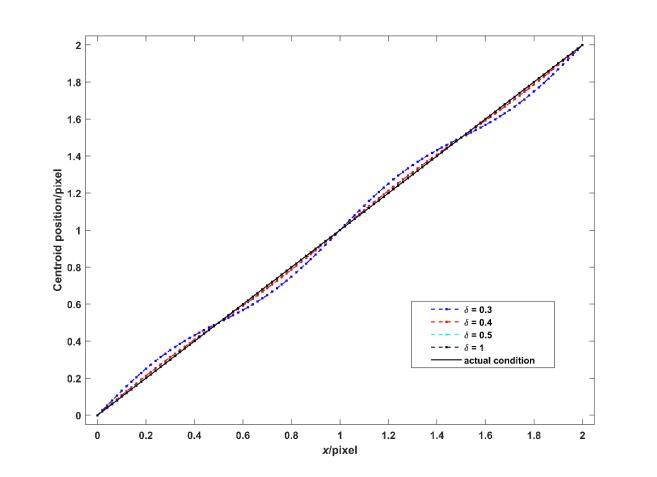
1/d was set as 1,and the Gaussian radius of the optical system was 0.3,0.4,0.5,and 1 pixel. The spot energy center initiates from 0 and moves 100 times in steps of 0.02 pixels,. Fig. 1 illustrates the simulation results.
The spot position calculated by the centroid algorithm is based on the true energy center ,and one pixel is a period that presents a sinusoidal distribution. When the Gaussian radius of the optical system was 0.3,0.4,0.5,and 1 pixel,the maximum positioning errors were 0.054,0.014,0.002,and 0 pixels,respectively. The positioning accuracy improves as increases. If the spatial lossless sampling of the detector is not satisfied,an error occurs when using the centroid algorithm to locate the light spot received by the detector. When the spatial sampling frequency 1/d of the detector is not less than the spatial cut-off frequency of the modulation transfer function of the optical system at the front of the detector,the error caused by the centroid algorithm can be ignored completely.
3 Effect of nonuniformity on target positioning accuracy
3.1 Quantification and simulation of pixel response nonuniformity
The photo response nonuniformity of the flat-panel detector is the inconsistent response of different pixels to the same incident radiation. This is associated with the variations in the quantum efficiency and other parameters of different pixels in the device manufacturing process[20]. The nonuniformity of detectors can be measured using two methods. One method involves changing the brightness of external light sources,such as the integrating sphere,and calculating the nonuniformity by measuring the changes in the response data [21]. The other adjusts the internal gain,such as the exposure time,and measures the response data of different pixels under the same lighting conditions [22]. Assuming that the actual response gray level of each pixel in the detector is different under uniform illumination,the average value is with a standard deviation of .
.
To investigate the effect of the nonuniformity of the detector on the positioning accuracy of the spot centroid under the working conditions used in this study,we define the nonuniformity of the response NU as
.
NU is used as an index to quantify the corresponding nonuniformity of the pixel and simulate it to different nonuniformity images. The window size of the detector was set to 32 × 32 pixels,and the size of the light spot on the image was 5 × 5 pixels. The energy of the light spot conformed to the Gaussian distribution,and the response values of all pixels in the light spot area were within the linear response range. The response model parameters for each pixel within the window range were different.
It is an ideal hypothetical condition that the detector is under uniformly distributed illumination. In the dark environment of the laboratory,using an integrating sphere as a light source can approximately achieve the above condition. The response gray level of the pixel measured by the flat-panel detector under this condition can be used to calculate the NU value to calibrate the nonuniformity. The response gray level of the pixel measured by the flat-panel detector under this condition can be used to calculate the NU value to calibrate the nonuniformity. If the above experimental conditions are not met,the gray images obtained cannot be used for nonuniformity calibration. That is,for the definition of NU value,the calculation is accurate only under approximately ideal conditions,otherwise,it is unreliable.
Table 1 and Fig. 2 present the simulation results of the positioning error of the centroid at different NU values of the detector. The simulation step was 0.05 pixels along the X-axis,and the centroid of the simulated spot moved from 14.5 to 16.5. A total of two pixels existed corresponding to 40 steps. The threshold centroid algorithm was used to locate the centroid of the spot.
Fig. 3 depicts the simulation results of the positioning error considering the increase in the NU value. The fitting method was used to process the scattered points to obtain the general model with the expression
.
Figure 3.Changes in the positioning error with nonuniformity
To satisfy the requirements for spot positioning accuracy in actual optical communication scenarios,the obtained results can be combined to determine the necessity of nonuniformity correction. Commonly used correction algorithms include two-point correction,piecewise linear correction [23],polynomial fitting correction [24],full variational adaptive correction [25],pixel-by-pixel linear correction [26],backpropagation neural network correction [27],and nonuniform flat field calibration [28]. An appropriate algorithm can be chosen based on multiple factors,such as complexity and storage size,to compensate for the error caused by the nonuniformity of the pixel response.
3.2 Effect of light intensity changes on positioning accuracy
Although the detector must operate in the linear response range of the pixels in practical applications,the signal response amplitude of the pixel at the center of the spot is not a constant value owing to the varying intensity of the incident light. A simulation was performed considering a scenario where the actual position of the light spot remains constant with the light intensity changing from low to high. The energy of the spot was set to conform to the Gaussian distribution,and the true center position on the X-axis was 8. When the values of NU are 0.005,0.01,0.02,and 0.04,the simulation generates an image with a size of 16 × 16 pixels and a spot size of 5 × 5 pixels. The ideal amplitude of the pixel signal response at the center of the spot ranges from 30 to 120 with an interval of 10;the responses of other pixels were obtained using the settings identical to those described in section 3.1.
Fig. 4 illustrates the obtained simulation results of the centroid position on the X-axis. When the light intensity of the target incident on the optical system is constantly changing,the actual detected centroid position changes owing to the nonuniformity of the pixel response to the detector,which generates positioning errors. The smaller the NU value representing nonuniformity,the closer the centroid position is to the true position of the light spot. When the values of NU are 0.005,0.01,0.02,and 0.04,the maximum positioning errors are 0.024,0.032,0.053,and 0.069 pixels,respectively,and the fitted equation is
.
Figure 4.The centroid position of the spot under different light intensities
Equations(12)and(13)are the optimal solutions in a variety of data fitting models. These fitting models include linear least squares,polynomial fitting,least-squares optimization,exponential function fitting,power function fitting,rational function fitting,and Weibull cumulative distribution function fitting. The coefficients in the Equations use fitting constants within the 95% confidence interval. Regression analysis is performed on the obtained results,and the fitting evaluation coefficient R-squared is selected as an indicator to evaluate the model. The closer the value of the parameter R-squared is to 1,the better the fitting effect of the model. The MATLAB toolbox is used as an auxiliary tool in the fitting process.
In actual applications,the light intensity incident on the optical system should be maintained stable,and the reasonable working range of the flat-panel detector needs to be calibrated. Alternatively,a suitable nonuniformity correction algorithm can be used.
4 Experimental verification
4.1 Response of the pixels in the detector under uniform illumination
An integrating spherical light source was used to generate different illuminances in the dark environment of the laboratory and the response of multiple pixels was measured within the window range of the flat-panel detector. The window size of the detector was set to 256 × 256 pixels and 16 images were collected without light. The average value of the pixel response was set as the base. The camera collected 100 images continuously each time the brightness of the integrating spherical light source was adjusted;a total of 11 energy levels were collected.
Fig. 5 illustrates the curve,which is the actual response readout value of 64 × 64 pixels close to the center of the detector array at different illuminances,considering a window size of 256 × 256 pixels. The response value of the pixel under each light intensity is the result of collecting 50 frames of spot images continuously,subtracting the dark background,and calculating the average,which significantly reduces the random error;thus,the pixel response change is affected almost only by nonuniformity.
Figure 5.Response curves of different pixels under different light intensities
A polynomial fitting method was adopted to establish a mathematical model for the nonuniformity of the pixel response. The expression is
.
where represents the ideal pixel response, indicates the actual pixel response,and ,,and denote the quadratic,gain,and bias coefficients,respectively. Based on the results of the statistical simulations,,,and in(14)are random numbers with mean values of ,0.88 and 2.972,and standard deviations of ,0.021,and 0.682,respectively. Furthermore,the calculated NU values were all between 0.0045 and 0.0048 in the linear response range of 30 to 120.
4.2 Positioning accuracy of a moving target
To test the positioning accuracy of the flat-panel detector and verify its impact on high-precision pointing in space optical communication,we constructed a test experimental device using the same parameters as described in section 3. The entire experimental system was placed on an air-floating platform. The beacon light emitted by the laser was passed through a collimator tube with an equivalent length of 10 m to generate parallel light,which converged on the detector through a camera lens with a focal length of 35 mm. The detector located the beacon light spot.
The pixel size d of the CMOS detector used in this experiment was 5.5 μm,the beacon light wavelength λ was 810 nm,the combined focal length f of the detection system was 35 mm,and the effective aperture D of the detection system was 4.38 mm,which satisfies(5). This eliminates the systematic error of the algorithm in the centroid-positioning process.
The beacon light source was moved step-by-step using a high-precision electronically controlled microtranslation stage. The distance of each step was 78.5 μm,corresponding to 0.05 pixels on the flat-panel detector;a total of 40 steps were tested. The method mentioned in section 1 was used to perform a noise removal for the image obtained at each step. Fig. 6 depicts the spot position calculated by the centroid algorithm based on threshold processing. The maximum positioning error was 0.049 pixels with an average of 0.027 pixels and a root mean square(RMS)value of 0.014 pixels. Considering that the environmental conditions of the experiment inevitably result in certain errors,the result was consistent with the simulation result of 0.043 pixels.
Figure 6.True position and centroid position of a moving target
To achieve high-precision links in space optical communication systems,we systematically analyzed the positioning error of the spot centroid of a flat-panel detector used in the communication terminal. The systematic error primarily originates from the centroid algorithm and the inherent nonuniformity of the area array detector. In this study,the centroid algorithm error was analyzed theoretically and the simulation results of the spatial non-destructive sampling conditions were investigated. The target spot diameter must be greater than 2.44 pixels. The ratio of the standard deviation of the actual response gray level to the average value of NU under uniform illumination was used to quantify the nonuniformity of the detector. The simulation results verify that the centroid positioning error continues to increase as NU increases linearly from 0;however,a speed reduction can be observed. This can be summarized as indicated in(12)of the general model of the flat-panel detector. Considering that the light intensity of the target incident on the optical system is changing constantly,the position of the center of mass is closer to the true position of the light spot with the decrease in NU value,and the quantitative relationship is presented in(13). Finally,the response of pixels in a typical CMOS detector was experimentally tested with different light intensities,and a mathematical model for the nonuniformity of the pixel response was established through a polynomial fitting method. The NU value fluctuated from 0.0045 to 0.0048 within the linear response range. Additionally,the experiments were conducted by moving the target to test the centroid positioning accuracy of a flat-panel detector. The maximum error observed was 0.049 pixels,which is consistent with the theoretical analysis and simulation results of this study.
[18] S J Chen, L Zhang, J C Wu et al. Realization and optimization of fine tracking system of free space laser communication. Journal Of Infrared And Millimeter Waves, 37, 35-46(2018).
Xu WANG, Cheng-Xiang TU, Liang ZHANG, Jian-Yu WANG. Analysis and verification of the positioning accuracy of a flat-panel detector used for precision pointing in space optical communication[J]. Journal of Infrared and Millimeter Waves, 2022, 41(3): 631