• Laser & Optoelectronics Progress
  • Vol. 58, Issue 2, 0215001 (2021)
Wei Song*, Xinyu Wei, Minghua Zhang, and Qi He*
Author Affiliations
  • College of Information Technology, Shanghai Ocean University, Shanghai 201306, China
  • show less
    DOI: 10.3788/LOP202158.0215001 Cite this Article Set citation alerts
    Wei Song, Xinyu Wei, Minghua Zhang, Qi He. Stereo Matching Based on Improved Cost Calculation and a Disparity Candidate Strategy[J]. Laser & Optoelectronics Progress, 2021, 58(2): 0215001 Copy Citation Text show less
    Algorithm flow
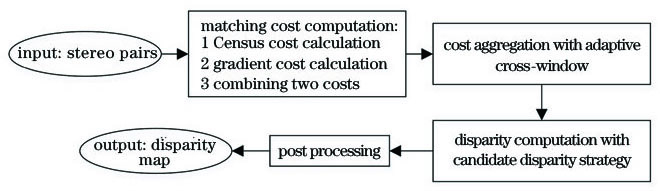
    Fig. 1. Algorithm flow
    Coding process of L-Census
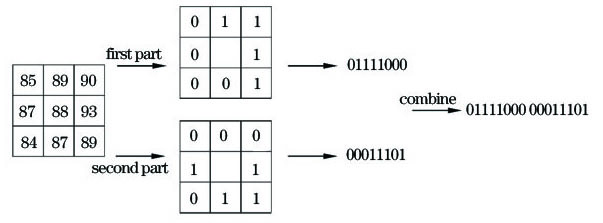
    Fig. 2. Coding process of L-Census
    Failure diagram in the boundary area of the object, in which the correct matching point of p is q, but the corresponding mismatching point is e obtained by Eq. (3). (a) Part of left image of Teddy; (b) part of right image of Teddy
    Fig. 3. Failure diagram in the boundary area of the object, in which the correct matching point of p is q, but the corresponding mismatching point is e obtained by Eq. (3). (a) Part of left image of Teddy; (b) part of right image of Teddy
    Illustration of the effectiveness of the adaptive weighted combining strategy of bidirectional gradient cost
    Fig. 4. Illustration of the effectiveness of the adaptive weighted combining strategy of bidirectional gradient cost
    Disparity maps obtained by different horizontal and vertical gradient costs combining methods. (a) Original image; (b) real disparity map; (c) disparity map obtained using Eq. (3); (d) disparity map obtained using ABiGrad
    Fig. 5. Disparity maps obtained by different horizontal and vertical gradient costs combining methods. (a) Original image; (b) real disparity map; (c) disparity map obtained using Eq. (3); (d) disparity map obtained using ABiGrad
    Construction of adaptive cross window. (a) Cross arm; (b) adaptive support area
    Fig. 6. Construction of adaptive cross window. (a) Cross arm; (b) adaptive support area
    Area to verify the "candidate disparities" idea
    Fig. 7. Area to verify the "candidate disparities" idea
    Flow chart of disparity calculation
    Fig. 8. Flow chart of disparity calculation
    Pseudo code for disparity calculation
    Fig. 9. Pseudo code for disparity calculation
    Effect of parameters changing on error rate. (a) Variation of error rate with λGrad; (b) variation of error rate with λCensus; (c) variation of error rate with M; (d) variation of error rate with τc; (e) variation of error rate with τd
    Fig. 10. Effect of parameters changing on error rate. (a) Variation of error rate with λGrad; (b) variation of error rate with λCensus; (c) variation of error rate with M; (d) variation of error rate with τc; (e) variation of error rate with τd
    Disparity maps obtained by different cost calculation methods. (a) Reference image; (b) real disparity map; (c) AD-Cen; (d) AD-Grad; (e) LCen-ABiGrad
    Fig. 11. Disparity maps obtained by different cost calculation methods. (a) Reference image; (b) real disparity map; (c) AD-Cen; (d) AD-Grad; (e) LCen-ABiGrad
    Advantages of DC over WTA in the repeated texture area (straight frame), weak texture area (dotted frame) and untextured area (double straight frame). (a) Reference image; (b) disparity map obtained by WTA; (c) disparity map obtained by DC; (d) marked disparity map
    Fig. 12. Advantages of DC over WTA in the repeated texture area (straight frame), weak texture area (dotted frame) and untextured area (double straight frame). (a) Reference image; (b) disparity map obtained by WTA; (c) disparity map obtained by DC; (d) marked disparity map
    Results of our algorithm on standard stereo image pairs. (a) Reference image; (b) real disparity map; (c) disparity map generated by our algorithm; (d) mismatching map
    Fig. 13. Results of our algorithm on standard stereo image pairs. (a) Reference image; (b) real disparity map; (c) disparity map generated by our algorithm; (d) mismatching map
    Candidate disparityd(1)d(2)d(3)d(4)OthersSum
    Proportion53.312.16.03.724.9100.0
    Table 1. Correct rate of each candidate disparity unit: %
    ParameterL1L2τ1τ2τ3λCensusλGradτVNτVRMτcτd
    Value173420620131200.421.0910
    Table 2. Experimental parameter setting
    AlgorithmTsukubaTeddyArtMoebiusBooksWood1Cloth2Laundry
    AD-Cen4.4815.2031.8020.8024.4026.2018.2032.80
    AD-Grad4.3517.7032.0022.0025.0026.6018.8030.30
    LCen-AbiGrad4.0615.1030.5018.2021.5024.8018.0027.90
    AlgorithmBowling1Baby1AloeLampshade1Midd1Rocks1Wood2ReindeerAve(all)
    AD-Cen31.9015.0016.5023.4042.6013.9015.6030.1022.70
    AD-Grad35.8016.6018.9023.6043.3013.3015.2030.2023.40
    LCen-ABiGrad26.0015.0017.1020.0024.3013.0014.5026.7019.80
    Table 3. Mismatching rate of different cost calculation methods unit: %
    AlgorithmTeddyDollsReindeerBaby2Bowling2Cloth2Aloe
    WTA15.1018.0026.7017.2024.0018.0017.10
    SO14.4017.5024.8020.0024.0017.8015.00
    DC14.8017.9026.2016.7023.7017.5016.90
    AlgorithmFlowerpotsMidd1Midd2PlasticRocks2Rocks1Ave(all)
    WTA23.7024.3023.9034.9013.2013.0020.70
    SO25.6021.5019.1036.7012.9013.0020.18
    DC23.2023.1023.0034.9012.9012.8020.28
    Table 4. Mismatching rate of different disparity calculation strategies unit: %
    AlgorithmTsukubaVenusTeddyConesAverageerror
    N-occAllDiscN-occAllDiscN-occAllDiscN-occAllDisc
    Ours2.122.508.230.250.622.244.9711.0012.502.788.688.045.33
    SO+borders1.291.716.830.250.532.267.0212.2016.303.909.8510.206.03
    Assw-Grad1.572.007.320.891.003.187.2012.4016.103.689.188.626.10
    GradAdaptWgt2.262.638.990.991.394.928.0013.1018.602.617.677.436.55
    AdaptAggrDP1.573.508.271.532.6912.406.7914.3016.205.5313.2014.808.40
    Table 5. Mismatch rate of different algorithms on standard stereo picture pairs unit: %
    AlgorithmTsukubaVenusTeddyCones
    Ours0.91.43.53.3
    Assw-Grad1.72.84.23.9
    GradAdaptWgt24395959
    Table 6. Running time of different algorithms on standard stereo image pairs unit: s
    Wei Song, Xinyu Wei, Minghua Zhang, Qi He. Stereo Matching Based on Improved Cost Calculation and a Disparity Candidate Strategy[J]. Laser & Optoelectronics Progress, 2021, 58(2): 0215001
    Download Citation