
Peng Lu, Changku Sun, Peng Wang. Fringe Projection Phase-to-Height Mapping Model and Its Calibration Method[J]. Acta Optica Sinica, 2018, 38(2): 0212004
- Acta Optica Sinica
- Vol. 38, Issue 2, 0212004 (2018)
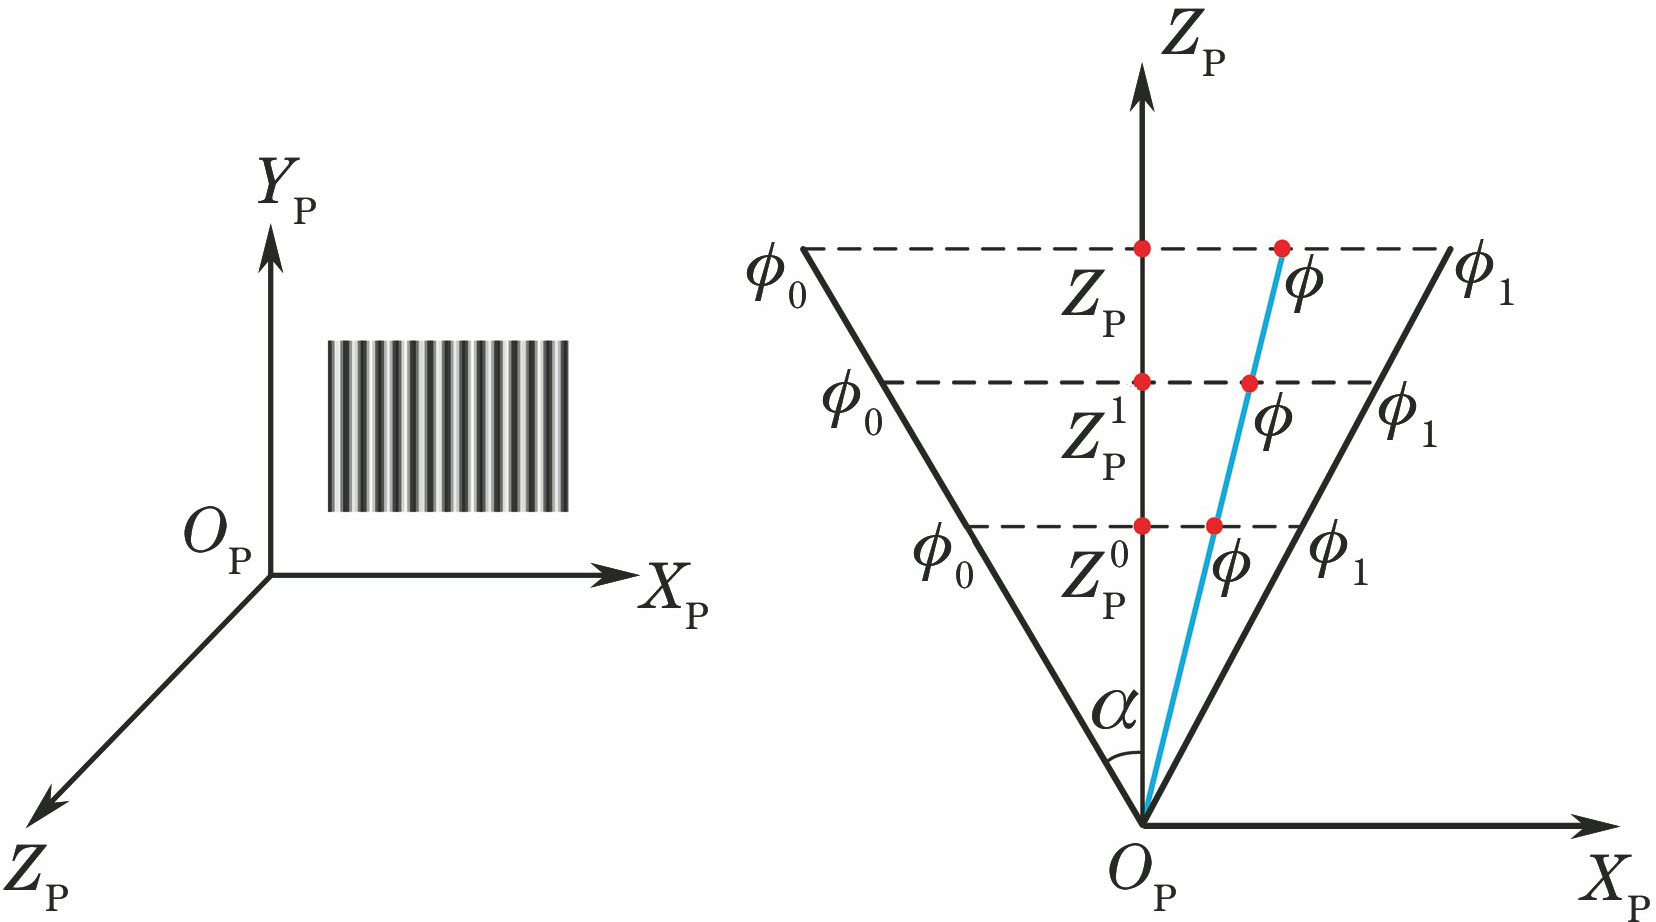
Fig. 1. Spatial relation between PCS and absolute phase map
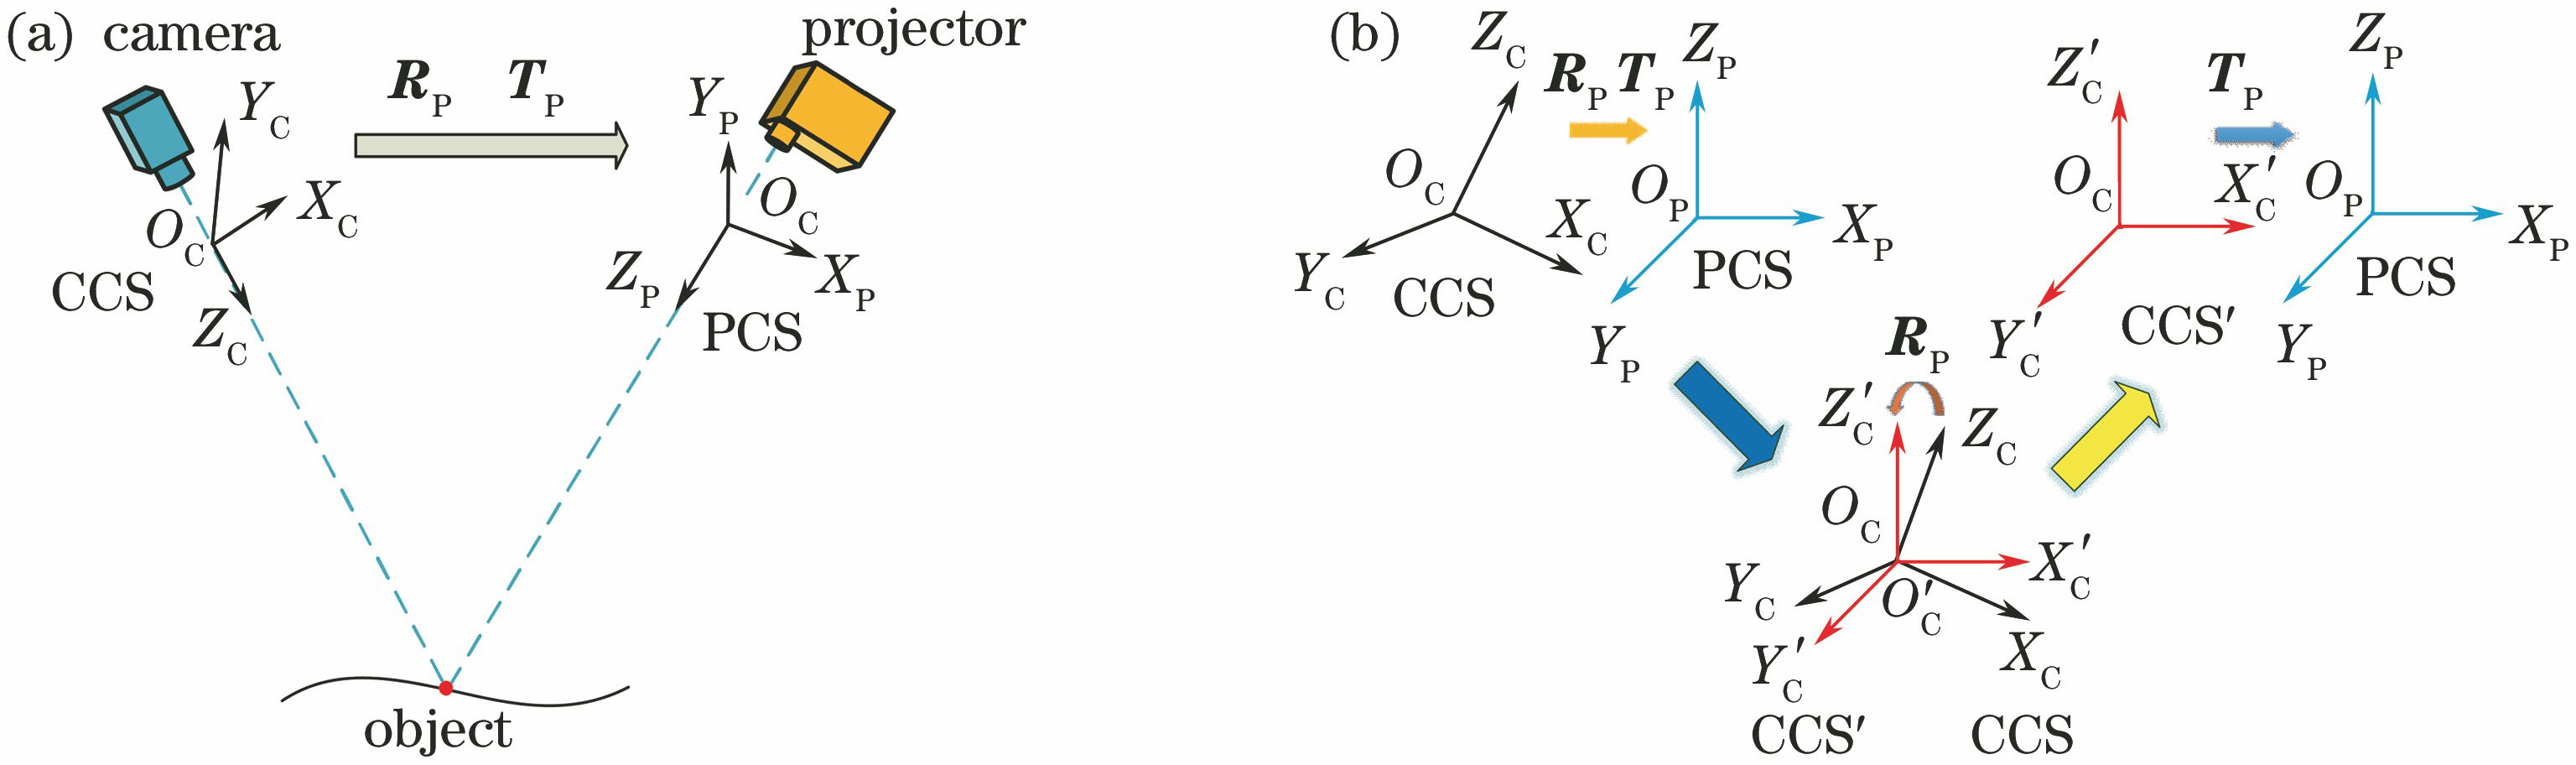
Fig. 2. Coordinate transformation relation. (a) Fringe projection 3D measurement system; (b) detailed coordinate transformation process
Fig. 3. Experimental setup
Fig. 4. Schematic diagram of calibration procedure
Fig. 5. Calibration evaluation. 3D reconstruction result of the feature points while (a) n=3, (c) n=4; error distribution of the feature points while (b) n=3, (d) n=4
Fig. 6. Calibration target
Fig. 7. Distance error distribution. (a) Line AD; (b) line BC
Fig. 8. Fitting planes. (a) Proposed method; (b) 4th-PMM; (c) CPHCM
Fig. 9. 3D shape measurement results of a sculpture and a hand. (a),(b) Fringe patterns; (c),(d) absolute phase map; (e),(f) 3D reconstruction results obtained by proposed method; (g),(h) 3D reconstruction results obtained by 4th-PMM model; (i),(j) 3D reconstruction results obtained by CPHCM model
| |||||||||||||||||||||||||||||||||||||||||||||||||||||||||||||||||||||
Table 1. Fitting results evaluationmm


Set citation alerts for the article
Please enter your email address

© Copyright 2018-2021 | Chinese Laser Press. All Rights Reserved 沪ICP备15018463号-20