• Acta Geographica Sinica
  • Vol. 75, Issue 7, 1494 (2020)
Yanjun WANG1、2、*, Baosheng WU1, and Deyu ZHONG1
Author Affiliations
  • 1State Key Laboratory of Hydroscience and Engineering, Tsinghua University, Beijing 100084, China
  • 2Key Laboratory of River Regulation and Flood Control of MWR, Yangtze River Scientific Research Institute, Wuhan 430010, China
  • show less
    DOI: 10.11821/dlxb202007012 Cite this Article
    Yanjun WANG, Baosheng WU, Deyu ZHONG. Simulation of the main-channel cross-section geometry of the Lower Yellow River in response to water and sediment changes[J]. Acta Geographica Sinica, 2020, 75(7): 1494 Copy Citation Text show less
    Sketch of Lower Yellow River
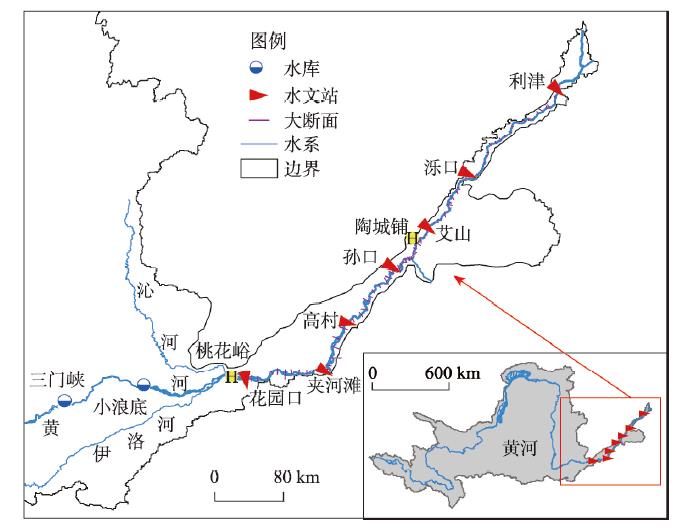
    Fig. 1. Sketch of Lower Yellow River
    Typical cross-sectional profile of Lower Yellow River
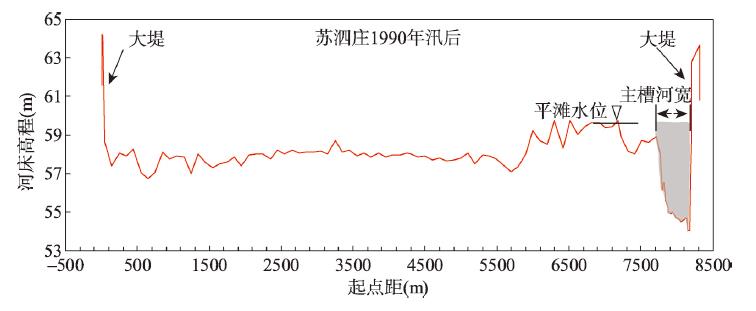
    Fig. 2. Typical cross-sectional profile of Lower Yellow River
    Temporal changes of water and sediment conditions at Huayuankou station
    Fig. 3. Temporal changes of water and sediment conditions at Huayuankou station
    Annual average values of main-channel cross-sectional parameters in different reaches
    Fig. 4. Annual average values of main-channel cross-sectional parameters in different reaches
    Temporal changes of relative main-channel cross-sectional parameters in different reaches
    Fig. 5. Temporal changes of relative main-channel cross-sectional parameters in different reaches
    Relationships between main-channel area and 4 a moving average water and sediment conditions in different reaches
    Fig. 6. Relationships between main-channel area and 4 a moving average water and sediment conditions in different reaches
    Relationships between main-channel width and 4 a moving average water and sediment conditions in different reaches
    Fig. 7. Relationships between main-channel width and 4 a moving average water and sediment conditions in different reaches
    Relationships between main-channel depth and 4 a moving average water and sediment conditions in different reaches
    Fig. 8. Relationships between main-channel depth and 4 a moving average water and sediment conditions in different reaches
    Relationships between main-channel cross-sectional geomorphic coefficient and 4 a moving average water and sediment conditions in different reaches
    Fig. 9. Relationships between main-channel cross-sectional geomorphic coefficient and 4 a moving average water and sediment conditions in different reaches
    Comparison between computed and measured main-channel area in different reaches
    Fig. 10. Comparison between computed and measured main-channel area in different reaches
    Comparison between computed and measured main-channel width in different reaches
    Fig. 11. Comparison between computed and measured main-channel width in different reaches
    Comparison between computed and measured main-channel depth in different reaches
    Fig. 12. Comparison between computed and measured main-channel depth in different reaches
    Comparison between computed and measured main-channel cross-sectional geomorphic coefficient in different reaches
    Fig. 13. Comparison between computed and measured main-channel cross-sectional geomorphic coefficient in different reaches
    Downstream changes of exponents a and b of main-channel cross-sectional parameters
    Fig. 14. Downstream changes of exponents a and b of main-channel cross-sectional parameters
    Downstream changes of weights of previous water and sediment conditions to main-channel cross-sectional parameters
    Fig. 15. Downstream changes of weights of previous water and sediment conditions to main-channel cross-sectional parameters
    时期1961—1964年1965—1973年1974—1980年1981—1985年1986—1999年2000—2015年
    径流量(亿m3)582.50430.10391.00503.58279.16254.48
    输沙量(亿t)7.8713.9910.959.006.860.95
    含沙量(kg/m3)13.5032.5428.0017.8624.573.73
    来沙系数(kg·s/m6)0.00730.02390.02260.01120.02780.0046
    Table 1. Statistics of incoming water and sediment conditions at Huayuankou station in different periods
    河段KabβR2KabβR2
    主槽面积(A)主槽河宽(W)
    花高段0.691.34-0.400.420.890.051.50-0.120.350.86
    高孙段0.751.28-0.380.400.861.130.93-0.040.340.86
    孙艾段4.400.97-0.210.370.8911.120.57-0.020.340.80
    艾利段23.350.71-0.170.350.9442.870.320.040.240.94
    主槽水深(h)主槽断面河相系数(ξ)
    花高段12.08-0.13-0.310.270.900.010.940.250.110.87
    高孙段0.640.36-0.340.420.791.090.150.360.120.63
    孙艾段0.380.42-0.210.420.8810.26-0.180.260.250.62
    艾利段0.450.43-0.230.450.8614.53-0.290.300.310.71
    Table 2. Coefficient values of Eq. (4) for main-channel cross-sectional parameters in different reaches
    Yanjun WANG, Baosheng WU, Deyu ZHONG. Simulation of the main-channel cross-section geometry of the Lower Yellow River in response to water and sediment changes[J]. Acta Geographica Sinica, 2020, 75(7): 1494
    Download Citation