Author Affiliations
School of Surveying and Land Information Engineering, Henan Polytechnic University, Jiaozuo, Henan 454000, Chinashow less
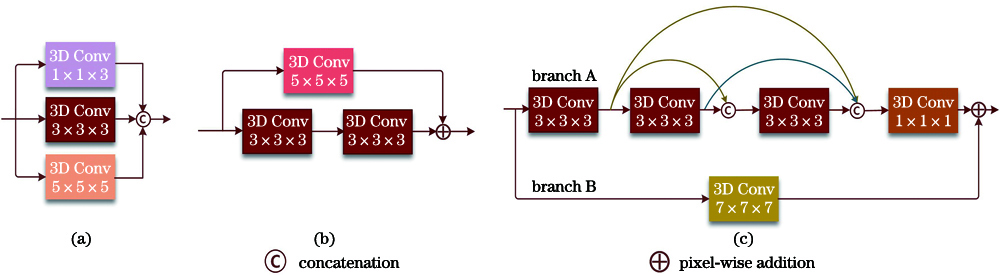
Fig. 1. Comparison of R-HybridSN and M-HybridSN modules. (a) Multi-scale convolutional layer of the first layer of R-HybridSN; (b) non-identical residual connection of the R-HybridSN; (c) multi-feature fusion module of the M-HybridSN
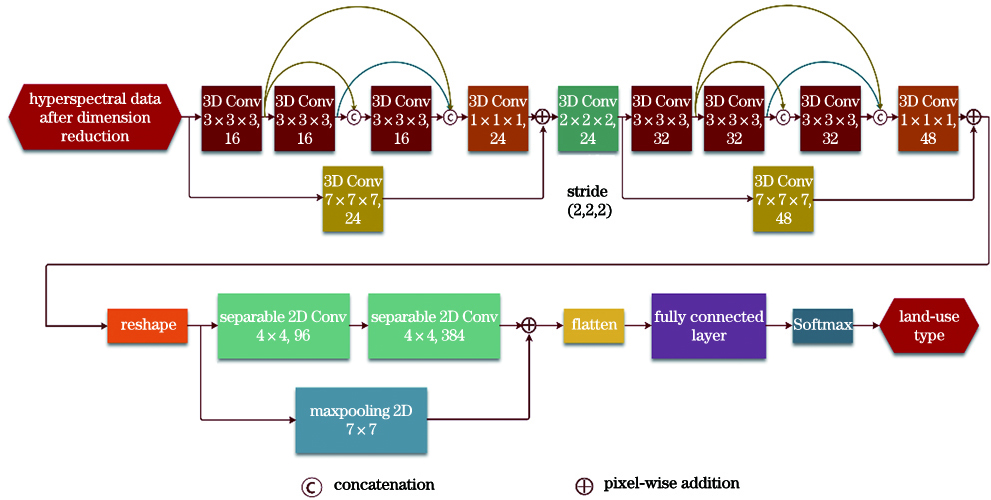
Fig. 2. Structure of the M-HybridSN
Fig. 3. Classification results of the data set IP
Fig. 4. Classification results of the data set SA
Fig. 5. Classification results of the data set PU
Fig. 6. Comparative experiment results under different conditions of the non-identical residual connection
| No. | Category | Labeled sample | Training | Validation | Testing |
|---|
| 1 | alfalfa | 46 | 2 | 3 | 41 | | 2 | corn-notill | 1428 | 71 | 72 | 1285 | | 3 | corn-mintill | 830 | 42 | 41 | 747 | | 4 | corn | 237 | 12 | 12 | 213 | | 5 | grass-pasture | 483 | 24 | 24 | 435 | | 6 | grass-trees | 730 | 36 | 37 | 657 | | 7 | grass-pasture-mowed | 28 | 2 | 1 | 25 | | 8 | hay-windrowed | 478 | 24 | 24 | 430 | | 9 | oats | 20 | 1 | 1 | 18 | | 10 | soybean-notill | 972 | 48 | 49 | 875 | | 11 | soybean-mintill | 2455 | 123 | 122 | 2210 | | 12 | soybean-clean | 593 | 30 | 29 | 534 | | 13 | wheat | 205 | 10 | 10 | 185 | | 14 | woods | 1265 | 63 | 63 | 1139 | | 15 | buildings-grass-trees-drives | 386 | 19 | 20 | 347 | | 16 | stone-steel-towers | 93 | 5 | 4 | 84 | | Total | 10249 | 512 | 512 | 9225 |
|
Table 1. Distribution situation of the data set IP
| No. | Category | Labeled sample | Training | Validation | Testing |
|---|
| 1 | brocoli_green_weeds_1 | 2009 | 20 | 20 | 1969 | | 2 | brocoli_green_weeds_2 | 3726 | 37 | 37 | 3652 | | 3 | fallow | 1976 | 20 | 20 | 1936 | | 4 | fallow_rough_plow | 1394 | 14 | 14 | 1366 | | 5 | fallow_smooth | 2678 | 27 | 27 | 2624 | | 6 | stubble | 3959 | 39 | 40 | 3880 | | 7 | celery | 3579 | 36 | 36 | 3507 | | 8 | grapes_untrained | 11271 | 113 | 112 | 11046 | | 9 | soil_vinyard_develop | 6203 | 62 | 62 | 6079 | | 10 | corn_senesced_green_weeds | 3278 | 33 | 33 | 3212 | | 11 | lettuce_romaine_4wk | 1068 | 11 | 10 | 1047 | | 12 | lettuce_romaine_5wk | 1927 | 19 | 20 | 1888 | | 13 | lettuce_romaine_6wk | 916 | 9 | 9 | 898 | | 14 | lettuce_romaine_7wk | 1070 | 11 | 10 | 1049 | | 15 | vinyard_untrained | 7268 | 72 | 73 | 7123 | | 16 | vinyard_vertical_trellis | 1807 | 18 | 18 | 1771 | | Total | 54129 | 541 | 541 | 53047 |
|
Table 2. Distribution situation of the data set SA
| No. | Category | Labeled sample | Training | Validation | Testing |
|---|
| 1 | asphalt | 6631 | 66 | 66 | 6499 | | 2 | meadows | 18649 | 186 | 186 | 18277 | | 3 | gravel | 2099 | 21 | 21 | 2057 | | 4 | trees | 3064 | 30 | 31 | 3003 | | 5 | painted metal sheets | 1345 | 14 | 13 | 1318 | | 6 | bare Soil | 5029 | 50 | 50 | 4929 | | 7 | bitumen | 1330 | 14 | 13 | 1303 | | 8 | self-blocking bricks | 3682 | 37 | 37 | 3608 | | 9 | shadows | 947 | 9 | 10 | 928 | | Total | 42776 | 427 | 427 | 41922 |
|
Table 3. Distribution situation of the data set PU
| Model | Res-2D-CNN | Res-3D-CNN | HybridSN | R-HybridSN | M-HybridSN |
|---|
| Parameter number | 1065360 | 231184 | 5122176 | 719112 | 659296 | | Input data scale | 5×5×200 | 9×9×200 | 25×25×30 | 15×15×16 | 15×15×16 |
|
Table 4. Parameter number and input data scale of different models
| No. | Res-2D-CNN | Res-3D-CNN | HybridSN | R-HybridSN | M-HybridSN |
|---|
| 1 | 9.51 | 23.78 | 58.54 | 58.17 | 65.61 | | 2 | 72.39 | 83.73 | 93.08 | 94.98 | 95.28 | | 3 | 60.31 | 76.53 | 96.57 | 97.38 | 97.36 | | 4 | 37.86 | 53.47 | 75.09 | 92.16 | 94.51 | | 5 | 80.14 | 93.54 | 94.00 | 96.68 | 97.01 | | 6 | 94.00 | 96.54 | 97.19 | 99.08 | 98.63 | | 7 | 34.60 | 71.20 | 82.40 | 94.00 | 99.80 | | 8 | 99.13 | 98.66 | 98.73 | 99.81 | 99.93 | | No. | Res-2D-CNN | Res-3D-CNN | HybridSN | R-HybridSN | M-HybridSN | | 9 | 3.89 | 67.50 | 83.89 | 63.06 | 76.67 | | 10 | 78.42 | 85.75 | 94.27 | 95.81 | 96.58 | | 11 | 84.12 | 90.02 | 97.93 | 98.31 | 98.55 | | 12 | 54.19 | 63.40 | 84.49 | 92.43 | 91.97 | | 13 | 85.16 | 88.43 | 92.68 | 98.46 | 97.41 | | 14 | 89.44 | 97.48 | 97.96 | 99.25 | 99.03 | | 15 | 52.98 | 79.35 | 83.18 | 92.52 | 96.80 | | 16 | 80.54 | 93.63 | 83.33 | 98.21 | 95.54 | | Kappa | 74.0 ± 2.8 | 84.5 ± 2.4 | 93.4 ± 1.2 | 96.3 ± 0.6 | 96.7 ± 0.4 | | OA | 77.28 ± 2.33 | 86.42 ± 2.13 | 94.26 ± 1.08 | 96.74 ± 0.52 | 97.09 ± 0.38 | | AA | 63.54 ± 4.66 | 78.94 ± 3.22 | 88.33 ± 2.40 | 91.90 ± 2.58 | 93.79 ± 1.99 |
|
Table 5. Classification results of the data set IP by different models unit: %
| No. | Res-2D-CNN | Res-3D-CNN | HybridSN | R-HybridSN | M-HybridSN |
|---|
| 1 | 66.09 | 97.13 | 99.98 | 100.00 | 99.92 | | 2 | 99.36 | 99.92 | 99.97 | 99.96 | 99.99 | | 3 | 61.79 | 93.00 | 99.82 | 99.62 | 99.56 | | 4 | 99.19 | 99.09 | 97.39 | 98.87 | 99.22 | | 5 | 94.62 | 97.75 | 98.79 | 98.83 | 99.21 | | 6 | 99.95 | 99.97 | 99.78 | 99.90 | 99.91 | | 7 | 97.34 | 98.24 | 99.77 | 99.88 | 99.91 | | 8 | 82.99 | 87.66 | 99.04 | 98.33 | 98.96 | | 9 | 99.19 | 99.58 | 100.00 | 99.99 | 99.96 | | 10 | 85.81 | 91.16 | 98.98 | 98.06 | 98.89 | | 11 | 83.73 | 90.83 | 98.95 | 98.62 | 98.83 | | 12 | 98.32 | 99.20 | 99.09 | 99.88 | 99.29 | | 13 | 95.23 | 97.88 | 97.28 | 92.41 | 96.99 | | 14 | 96.07 | 98.25 | 96.60 | 93.96 | 97.17 | | 15 | 70.49 | 77.52 | 98.57 | 96.61 | 98.90 | | 16 | 91.08 | 86.44 | 99.69 | 99.46 | 99.56 | | Kappa | 86.1 ± 1.6 | 91.6 ± 0.8 | 99.1 ± 0.3 | 98.5 ± 0.3 | 99.2 ± 0.3 | | OA | 87.54 ± 1.40 | 92.48 ± 0.69 | 99.20 ± 0.27 | 98.66 ± 0.31 | 99.30 ± 0.24 | | AA | 88.83 ± 2.64 | 94.60 ± 0.50 | 98.98 ± 0.28 | 98.40 ± 0.43 | 99.14 ± 0.30 |
|
Table 6. Classification results of the data set SA by different models unit: %
| No. | Res-2D-CNN | Res-3D-CNN | HybridSN | R-HybridSN | M-HybridSN |
|---|
| 1 | 92.18 | 90.81 | 92.15 | 96.21 | 95.04 | | 2 | 97.47 | 96.63 | 99.53 | 99.70 | 99.88 | | 3 | 15.33 | 66.54 | 90.51 | 90.93 | 93.77 | | 4 | 94.94 | 96.24 | 92.50 | 94.62 | 92.92 | | 5 | 99.45 | 99.86 | 97.75 | 99.79 | 99.57 | | 6 | 88.04 | 80.75 | 99.46 | 99.25 | 99.50 | | 7 | 40.70 | 68.12 | 96.25 | 94.36 | 94.92 | | 8 | 86.93 | 80.01 | 91.75 | 94.09 | 95.68 | | 9 | 97.40 | 97.38 | 75.04 | 94.23 | 92.85 | | Kappa | 85.0 ± 1.2 | 86.9 ± 1.9 | 94.8 ± 1.3 | 96.7 ± 0.6 | 96.8 ± 0.4 | | OA | 88.72 ± 0.85 | 90.16 ± 1.40 | 96.07 ± 0.96 | 97.55 ± 0.48 | 97.60 ± 0.33 | | AA | 79.16 ± 3.10 | 86.26 ± 2.10 | 92.77 ± 2.33 | 95.91 ± 0.96 | 96.01 ± 0.60 |
|
Table 7. Classification results of the data set PA by different models unit: %