
Pengfei Wu, Luyao Jia. Experimental Measurement and Analysis of Atmospheric Coherence Length in Xi'an Area[J]. Laser & Optoelectronics Progress, 2020, 57(9): 090101
- Laser & Optoelectronics Progress
- Vol. 57, Issue 9, 090101 (2020)
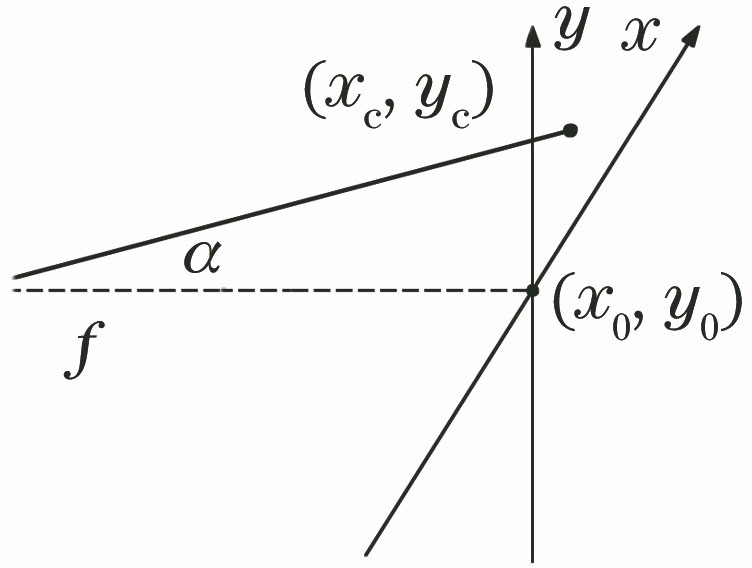
Fig. 1. Relationship between center of mass and angle of arrival
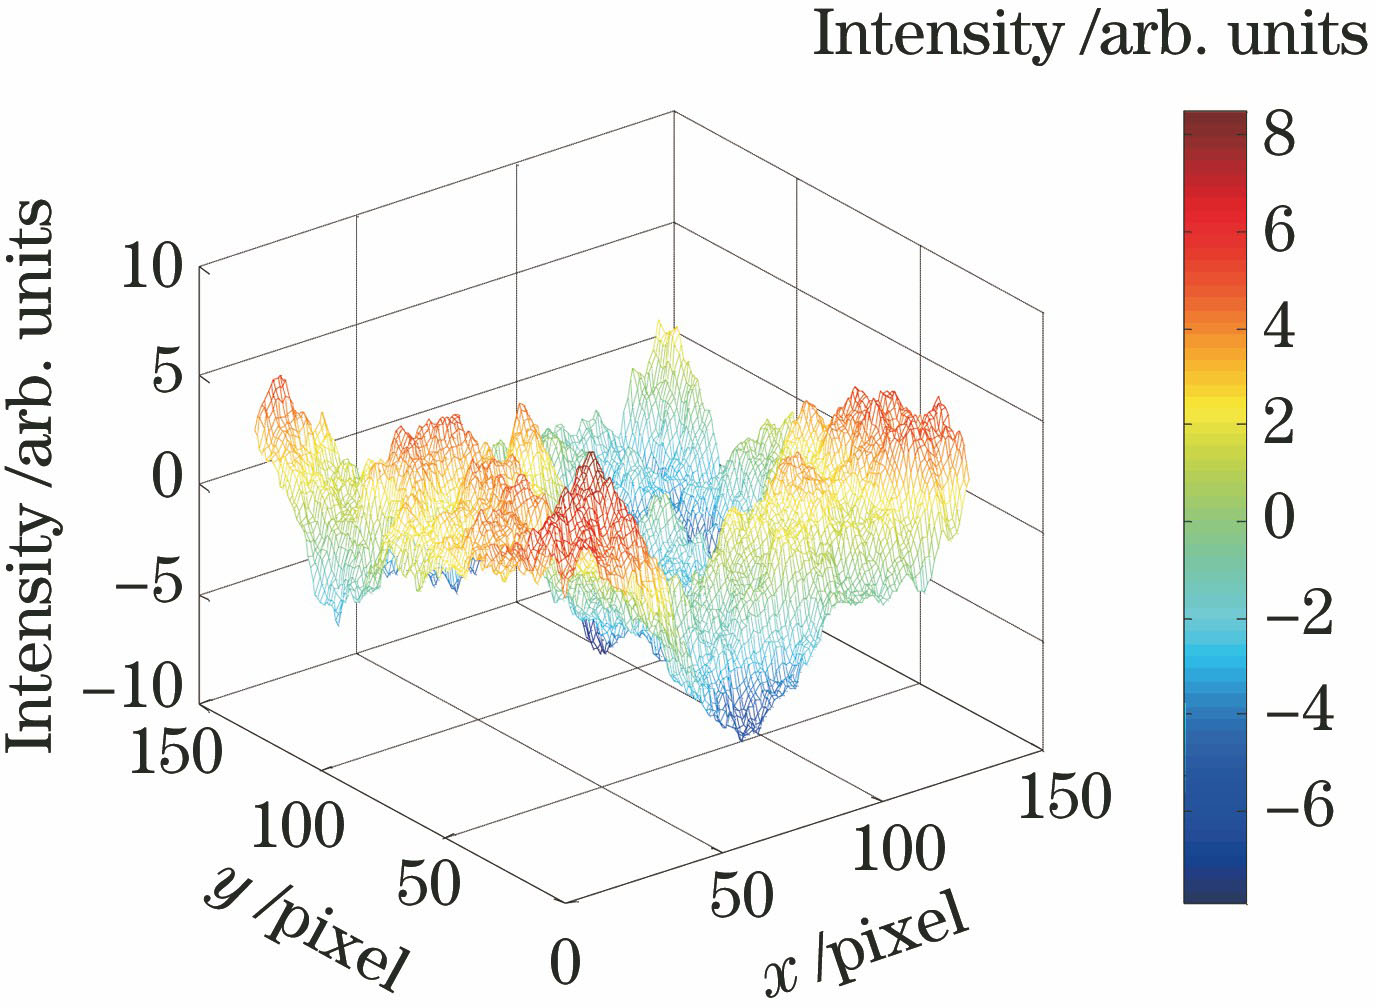
Fig. 2. Three-dimensional space distribution of simulated turbulent phase screen with r0=0.01 m
Fig. 3. Three-dimensional space distribution of simulated turbulent phase screen with r0=0.1 m
Fig. 4. Three-dimensional space distribution of simulated turbulent phase screen with r0=0.2 m
Fig. 5. Three-dimensional map of far-field light spot during vacuum transmission
Fig. 6. Light intensity distributions with r0=0.01 m. (a) Three-dimensional distribution; (b) two-dimensional distribution
Fig. 7. Light intensity distributions with r0=0.1 m. (a) Three-dimensional distribution; (b) two-dimensional distribution
Fig. 8. Light intensity distributions with r0=0.2 m. (a) Three-dimensional distribution; (b) two-dimensional distribution
Fig. 9. Composition of collection system
Fig. 10. Linear distance diagram of communication link
Fig. 11. Physical map of DIMM system transmitter
Fig. 12. Configuration of four aperture module
Fig. 13. Profile of industrial CCD camera
Fig. 14. DIMM system imaging effect
Fig. 15. Three-dimensional distribution of spot energy
Fig. 16. Atmospheric coherence length of continuous multi-frame images
Fig. 17. Measured atmospheric coherence length in four directions in a whole day
Fig. 18. Numerical comparison of measured atmospheric coherence lengths at daytime
Fig. 19. Measured nocturnal atmospheric coherence lengths
|
Table 1. Performance indexes of CCD camera

Set citation alerts for the article
Please enter your email address
© Copyright 2018-2021 | Chinese Laser Press. All Rights Reserved 沪ICP备15018463号-20