• Photonics Research
  • Vol. 11, Issue 1, 55 (2023)
Xue Wen1、2, Peng Lei3, Shengxin Huang4, Xiaoyu Chen1、2, Yanchi Yuan1、2, Di Ke1、2, Rui Liu1、2, Jiaxi Liang1、2, Erqi Wang1、2, Bo Wei4、5、*, Kedi Xiong1、2、6、*, and Sihua Yang1、2、7、*
Author Affiliations
  • 1MOE Key Laboratory of Laser Life Science & Institute of Laser Life Science, South China Normal University, Guangzhou 510631, China
  • 2Guangdong Provincial Key Laboratory of Laser Life Science, College of Biophotonics, South China Normal University, Guangzhou 510631, China
  • 3Institute of Biological and Medical Engineering, Guangdong Academy of Sciences, Guangzhou 510316, China
  • 4Department of Gastrointestinal Surgery, Third Affiliated Hospital, Sun Yat-sen University, Guangzhou 510182, China
  • 5e-mail: weibo3@mail.sysu.edu.cn
  • 6e-mail: xiongkd2012@163.com
  • 7e-mail: yangsh@scnu.edu.cn
  • show less
    DOI: 10.1364/PRJ.470737 Cite this Article Set citation alerts
    Xue Wen, Peng Lei, Shengxin Huang, Xiaoyu Chen, Yanchi Yuan, Di Ke, Rui Liu, Jiaxi Liang, Erqi Wang, Bo Wei, Kedi Xiong, Sihua Yang. High-fluence relay-based disposable photoacoustic-ultrasonic endoscopy for in vivo anatomical imaging of gastrointestinal tract[J]. Photonics Research, 2023, 11(1): 55 Copy Citation Text show less
    ECF-based optical waveguide strategy of endoscopic PAEM system. (a) Schematic diagram and photo of ECF; 0.25 pitch (∼0.8 mm) GRIN-F was fused to SCF equidistantly for collimated light emission. (b) Fiber end-face micrograph of SCF (9/125 μm) with step refractive index n1 to n2. (c) Fiber end-face micrograph of GRIN-F (100/125 μm) with gradient refractive index n1′. (d) Schematic diagram of optical path of endoscopic PAEM system, consisting of ORC, OPC, and distal-end probe. PIU, power interface unit. (e) Coupling relay for high-fluence and power-resistant optical waveguide; (f) prime relay for fixed-focus beam scanning.
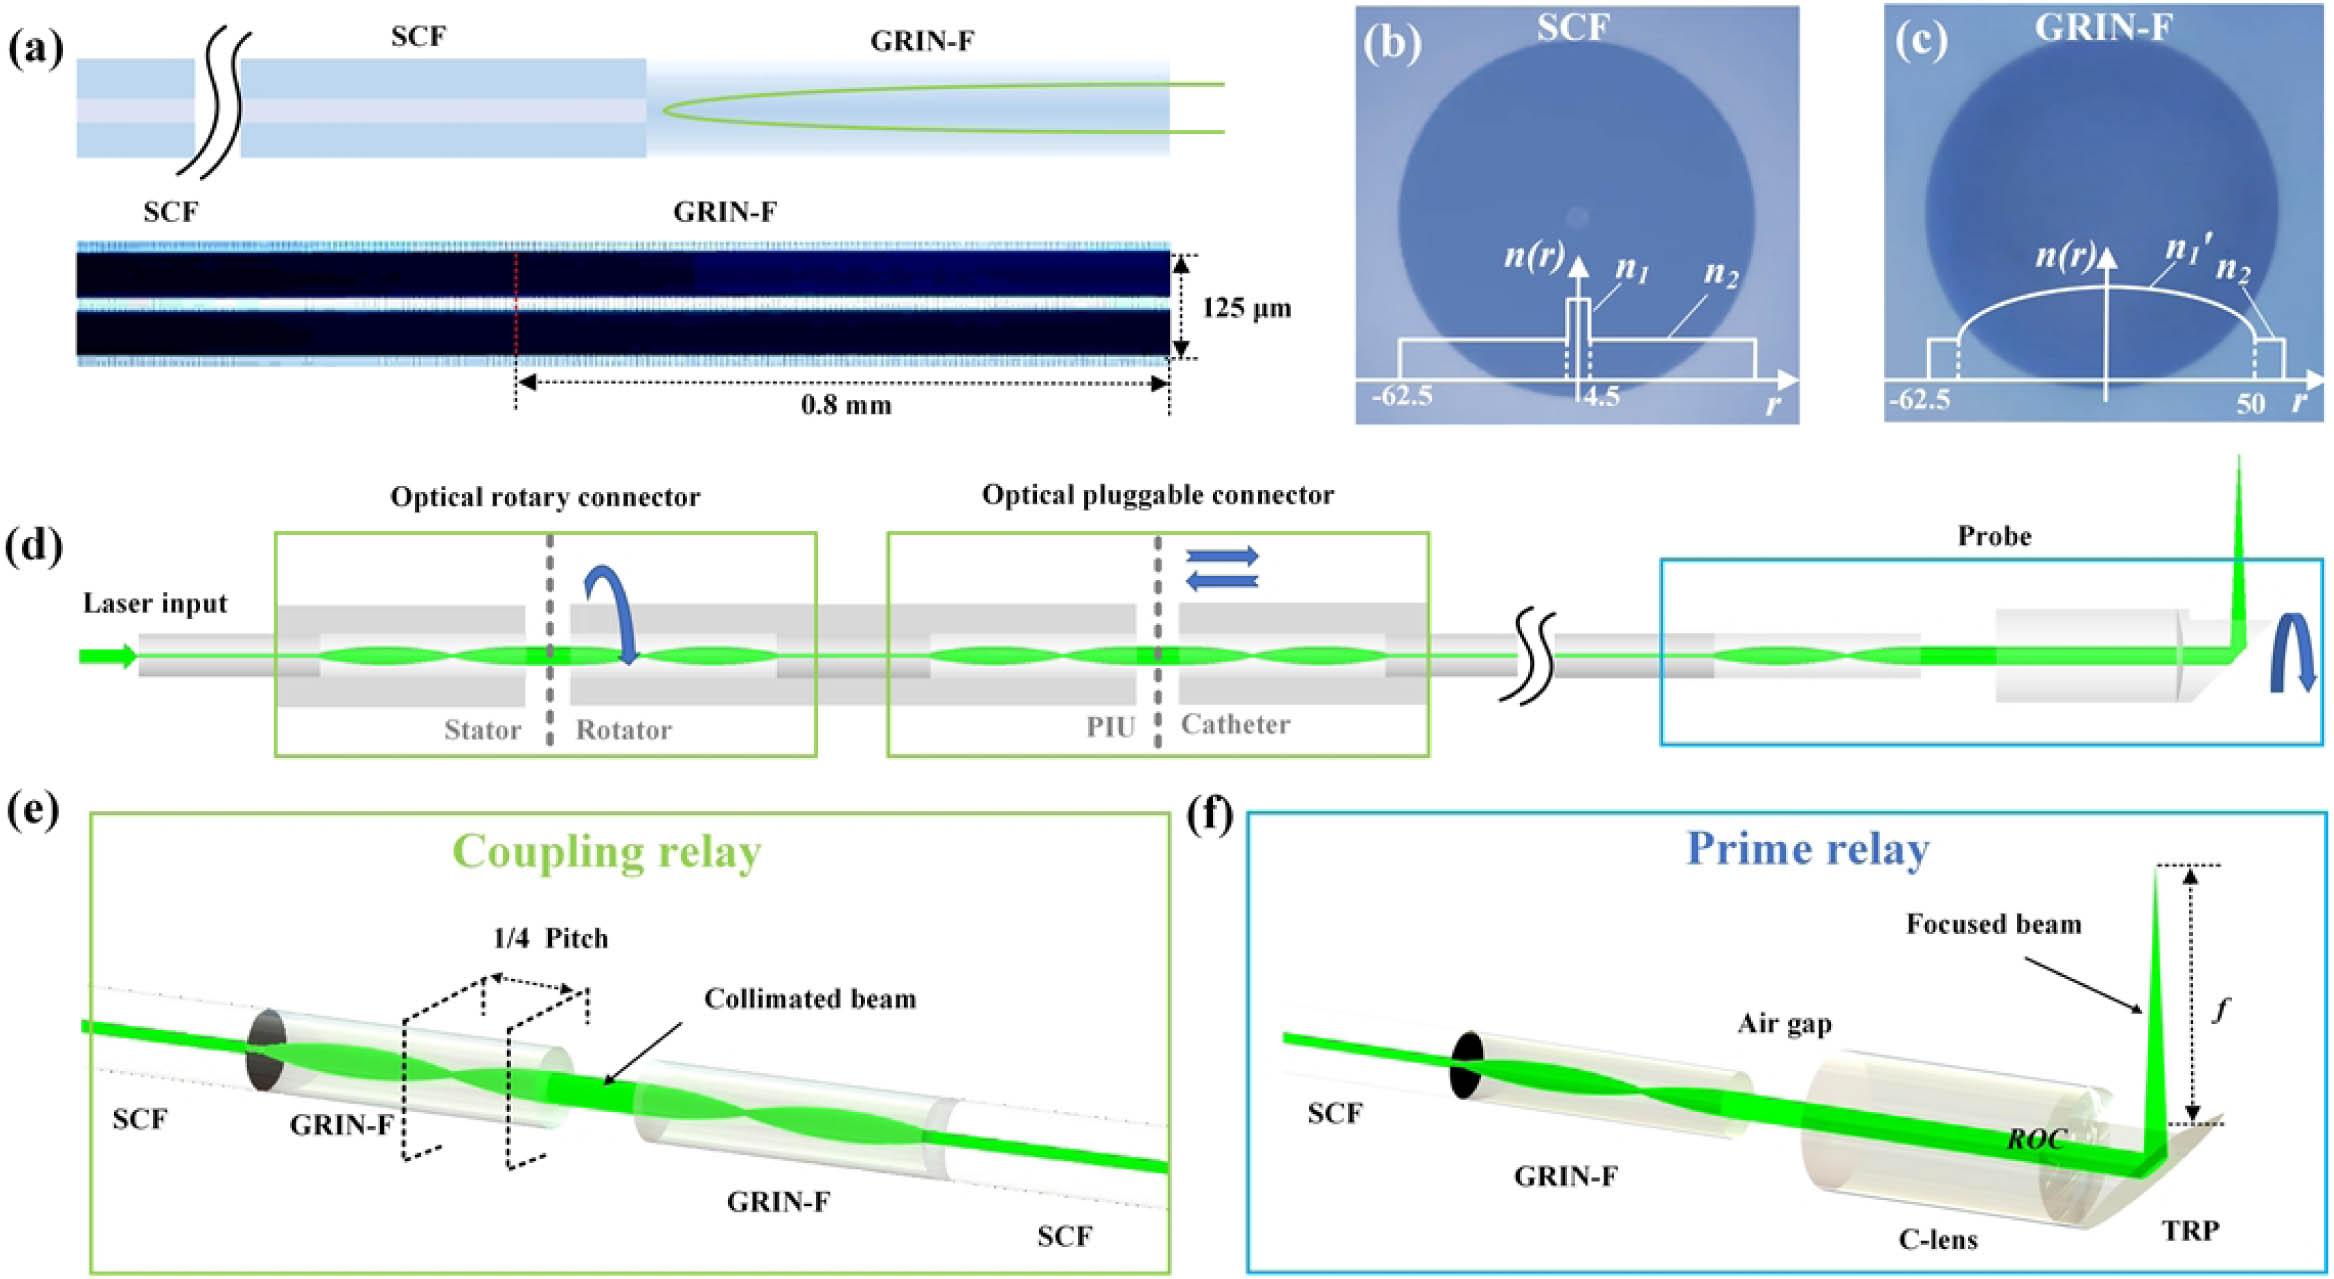
    Fig. 1. ECF-based optical waveguide strategy of endoscopic PAEM system. (a) Schematic diagram and photo of ECF; 0.25 pitch (0.8  mm) GRIN-F was fused to SCF equidistantly for collimated light emission. (b) Fiber end-face micrograph of SCF (9/125 μm) with step refractive index n1 to n2. (c) Fiber end-face micrograph of GRIN-F (100/125 μm) with gradient refractive index n1. (d) Schematic diagram of optical path of endoscopic PAEM system, consisting of ORC, OPC, and distal-end probe. PIU, power interface unit. (e) Coupling relay for high-fluence and power-resistant optical waveguide; (f) prime relay for fixed-focus beam scanning.
    Collinear designed PAEM-US mini-probe. (a) Schematic diagram of intra-instrument channel workable, PA, and US dual-mode imaging. (b) Schematic of PAEM-US probe with main integrated components. Inset, the section view. UT, ultrasonic transducer; TC, torque coil; S1, S2, sections 1 and 2; IW, imaging window; SG, sapphire glass; TRP, total reflection prism; SCF, single mode fiber. OC, optical channel; CC, cable channel. (c) Photograph of the fabricated PAEM-US endoscope; SUS, stainless steel. (d) Photograph of the mini-probe combined with upper electronic endoscope (2.8 mm ID channel). (e) PA lateral resolution. (f) US axial resolution. (g) Pulse response and frequency spectrum of the transducer. Fc, center frequency; BW, bandwidth.
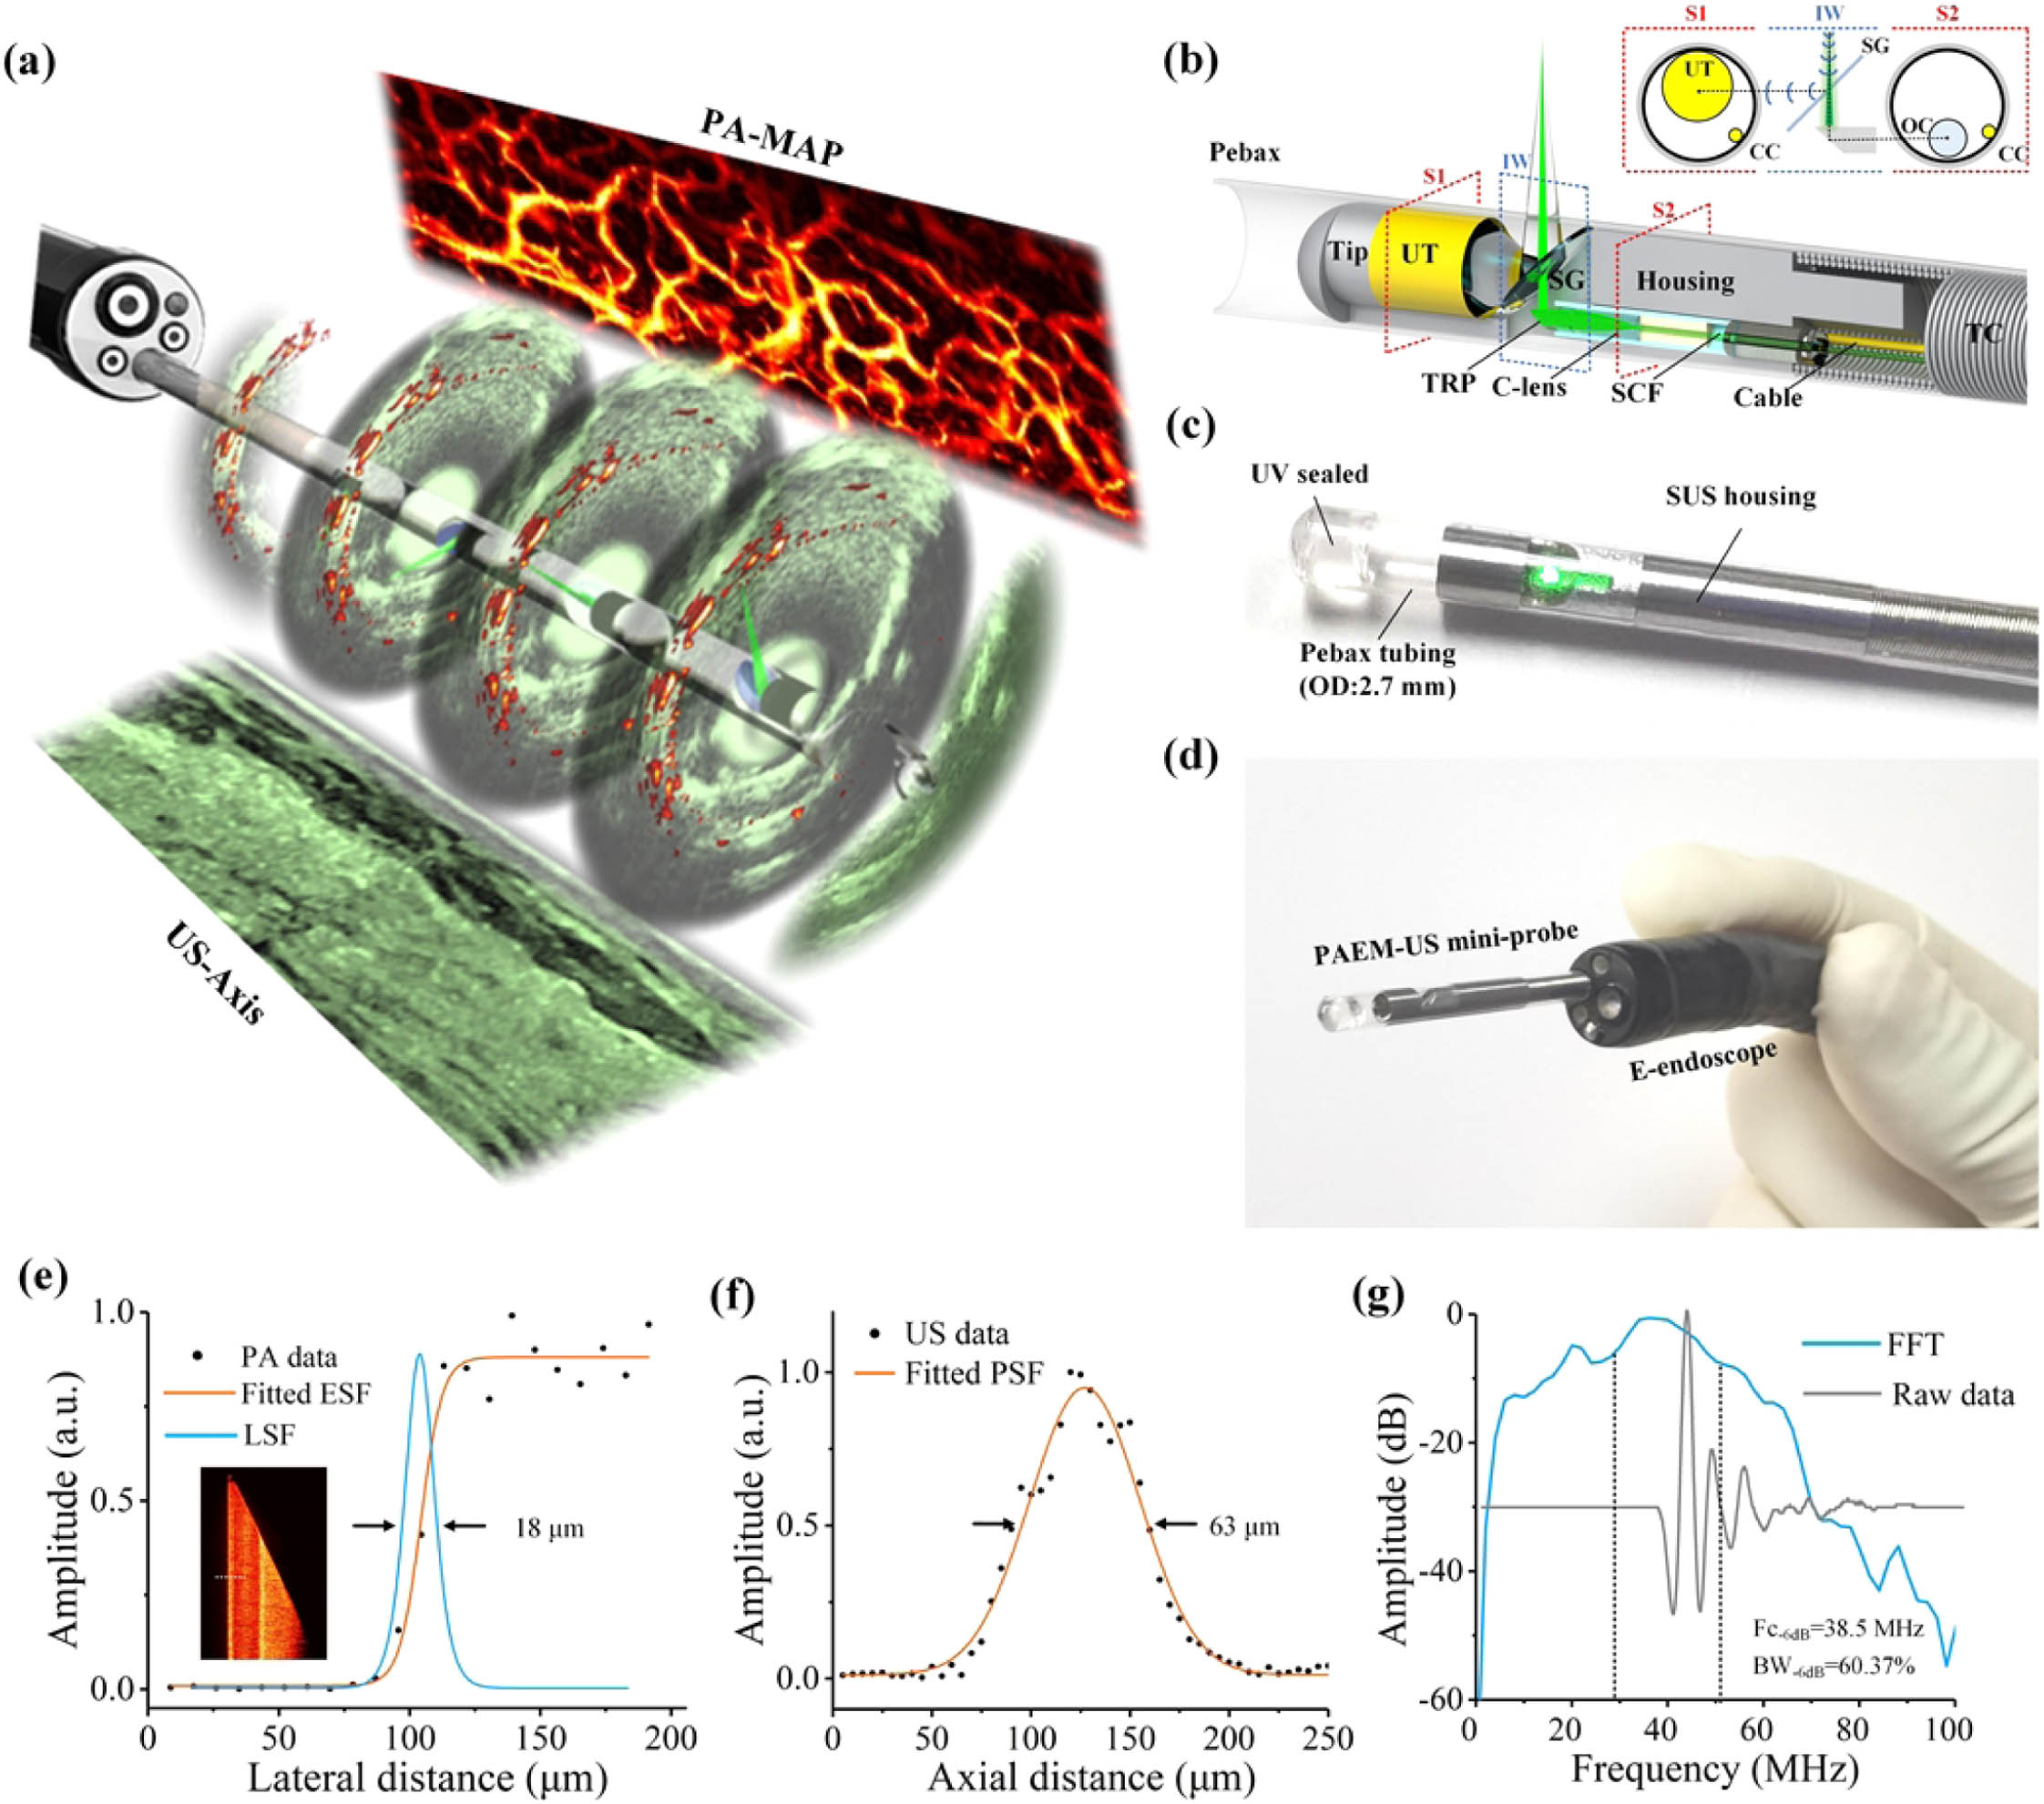
    Fig. 2. Collinear designed PAEM-US mini-probe. (a) Schematic diagram of intra-instrument channel workable, PA, and US dual-mode imaging. (b) Schematic of PAEM-US probe with main integrated components. Inset, the section view. UT, ultrasonic transducer; TC, torque coil; S1, S2, sections 1 and 2; IW, imaging window; SG, sapphire glass; TRP, total reflection prism; SCF, single mode fiber. OC, optical channel; CC, cable channel. (c) Photograph of the fabricated PAEM-US endoscope; SUS, stainless steel. (d) Photograph of the mini-probe combined with upper electronic endoscope (2.8 mm ID channel). (e) PA lateral resolution. (f) US axial resolution. (g) Pulse response and frequency spectrum of the transducer. Fc, center frequency; BW, bandwidth.
    Simulation and test of prime relay. (a) Schematic of SCF-based and ECF-based optical reshaping. (b) Simulated f as a function of the rear intercept b. (c) Simulated f and waist FWHM w as a function of the radius of curvature (ROC). (d) Simulation and measurement of f as a function of b. (e) Simulation and measurement of spot size along the beam axis.
    Fig. 3. Simulation and test of prime relay. (a) Schematic of SCF-based and ECF-based optical reshaping. (b) Simulated f as a function of the rear intercept b. (c) Simulated f and waist FWHM w as a function of the radius of curvature (ROC). (d) Simulation and measurement of f as a function of b. (e) Simulation and measurement of spot size along the beam axis.
    Prototypic disposable PAEM-US catheter and PAEM-PIU. (a) Diagram of PAEM-PIU. F-interface, female interface; M-interface, male interface; ESR, electrical slip ring; L, Luer connector. (b) Full view of the whole PAEM catheter. (c) Connection of the catheter and PIU. Inset, caps used to house the SC-type OPC and electrical pinholes. SC, shell connector; RC, retracement connector; EC, electrical connector; OC, optical connector.
    Fig. 4. Prototypic disposable PAEM-US catheter and PAEM-PIU. (a) Diagram of PAEM-PIU. F-interface, female interface; M-interface, male interface; ESR, electrical slip ring; L, Luer connector. (b) Full view of the whole PAEM catheter. (c) Connection of the catheter and PIU. Inset, caps used to house the SC-type OPC and electrical pinholes. SC, shell connector; RC, retracement connector; EC, electrical connector; OC, optical connector.
    ECF-based coupling relay for ORC and OPC. (a) Schematic of the output laser beam of SCF and ECF. (b) 2D spot profile of SCF and ECF at the axial distance L. Scale bar, 100 μm. (c) Spot size of ECF (Lp=0.7, 0.8, 0.9) and SCF as a function of L. (d) Coupling efficiency of ORC at different angle and rotating speed. (e) Coupling efficiency of OPC at different gap distance between two ECFs.
    Fig. 5. ECF-based coupling relay for ORC and OPC. (a) Schematic of the output laser beam of SCF and ECF. (b) 2D spot profile of SCF and ECF at the axial distance L. Scale bar, 100 μm. (c) Spot size of ECF (Lp=0.7, 0.8, 0.9) and SCF as a function of L. (d) Coupling efficiency of ORC at different angle and rotating speed. (e) Coupling efficiency of OPC at different gap distance between two ECFs.
    In vivo imaging results of rat colorectum. (a) 3D-volume-rendered result of rat colorectum with 2 cm retracement distance. (b) MAP view with 1 mm depth encoded. (c) Transverse view of PA image. (d) Transverse view of US image. Inset, the enlarged view of yellow dashed frame. (e) Immunohistochemical staining section labeled with CD31; M, mucosa; SM, submucosa; MC, muscularis; S, serosa. (f) Merged PA and US transverse view corresponding to the yellow dashed line in (b). (g) Enlarged view of yellow dashed frame in (f).
    Fig. 6. In vivo imaging results of rat colorectum. (a) 3D-volume-rendered result of rat colorectum with 2 cm retracement distance. (b) MAP view with 1 mm depth encoded. (c) Transverse view of PA image. (d) Transverse view of US image. Inset, the enlarged view of yellow dashed frame. (e) Immunohistochemical staining section labeled with CD31; M, mucosa; SM, submucosa; MC, muscularis; S, serosa. (f) Merged PA and US transverse view corresponding to the yellow dashed line in (b). (g) Enlarged view of yellow dashed frame in (f).
    PA depth-tomography results of rat colorectum. (a) Photograph of the rat colorectum imaging experiment. (b) Relative-depth encoded image with whole PA data. (c) Different depth of MAP view. (d) Statistics of vessel diameter and curvature as a function of depth. (e) Statistics of the number of vascular crossings and porosity as a function of depth.
    Fig. 7. PA depth-tomography results of rat colorectum. (a) Photograph of the rat colorectum imaging experiment. (b) Relative-depth encoded image with whole PA data. (c) Different depth of MAP view. (d) Statistics of vessel diameter and curvature as a function of depth. (e) Statistics of the number of vascular crossings and porosity as a function of depth.
    No.SCF-BasedECF-Based
    Coupling Rate (%)Damaged (Y/N)Threshold (μJ)Coupling Rate (%)Damaged (Y/N)Threshold (μJ)
    191.4Y3.094.5N10
    291.1Y2.994.2N10.1
    390.5Y2.994.6N10.1
    Table 1. Energy Coupling Efficiency and Damage Threshold of OPC
    No.SCF-BasedECF-Based
    Coupling Rate (%)Damaged (Y/N)Threshold (μJ)Coupling Rate (%)Damaged (Y/N)Threshold (μJ)
    163.4Y192N10.1
    254.1Y1.191.8N10
    357.5Y192.1N10
    Table 2. Energy Coupling Efficiency and Damage Threshold of ORC
    Rotating Speed (r/s)Coupling Rate (%)
    FactoryService
    2091.7891.5
    2590.7791
    3089.789.1
    Table 3. System Repeatability of ORC
    Xue Wen, Peng Lei, Shengxin Huang, Xiaoyu Chen, Yanchi Yuan, Di Ke, Rui Liu, Jiaxi Liang, Erqi Wang, Bo Wei, Kedi Xiong, Sihua Yang. High-fluence relay-based disposable photoacoustic-ultrasonic endoscopy for in vivo anatomical imaging of gastrointestinal tract[J]. Photonics Research, 2023, 11(1): 55
    Download Citation