
E. Brambrink, S. Baton, M. Koenig, R. Yurchak, N. Bidaut, B. Albertazzi, J. E. Cross, G. Gregori, A. Rigby, E. Falize, A. Pelka, F. Kroll, S. Pikuz, Y. Sakawa, N. Ozaki, C. Kuranz, M. Manuel, C. Li, P. Tzeferacos, D. Lamb, "Short-pulse laser-driven x-ray radiography," High Power Laser Sci. Eng. 4, 03000e30 (2016)
- High Power Laser Science and Engineering
- Vol. 4, Issue 3, 03000e30 (2016)
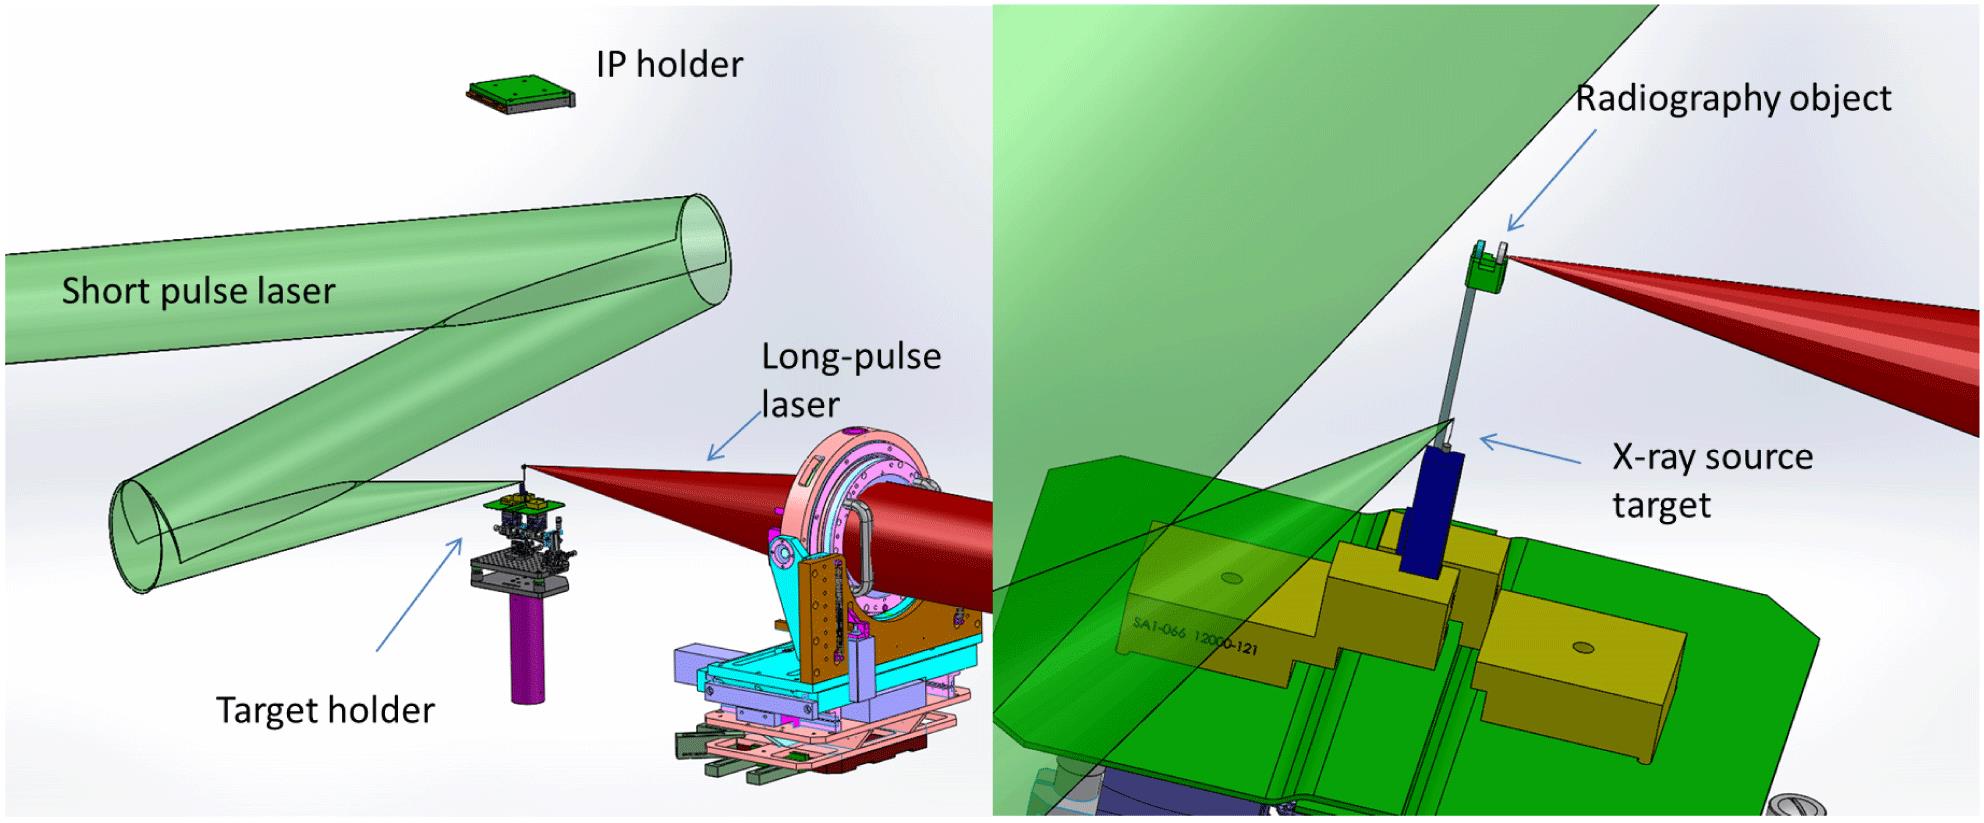
Fig. 1. Radiography setup with imaging plate, target holder and laser beams. On the right a magnification of the target holder with x-ray source and radiography sample.
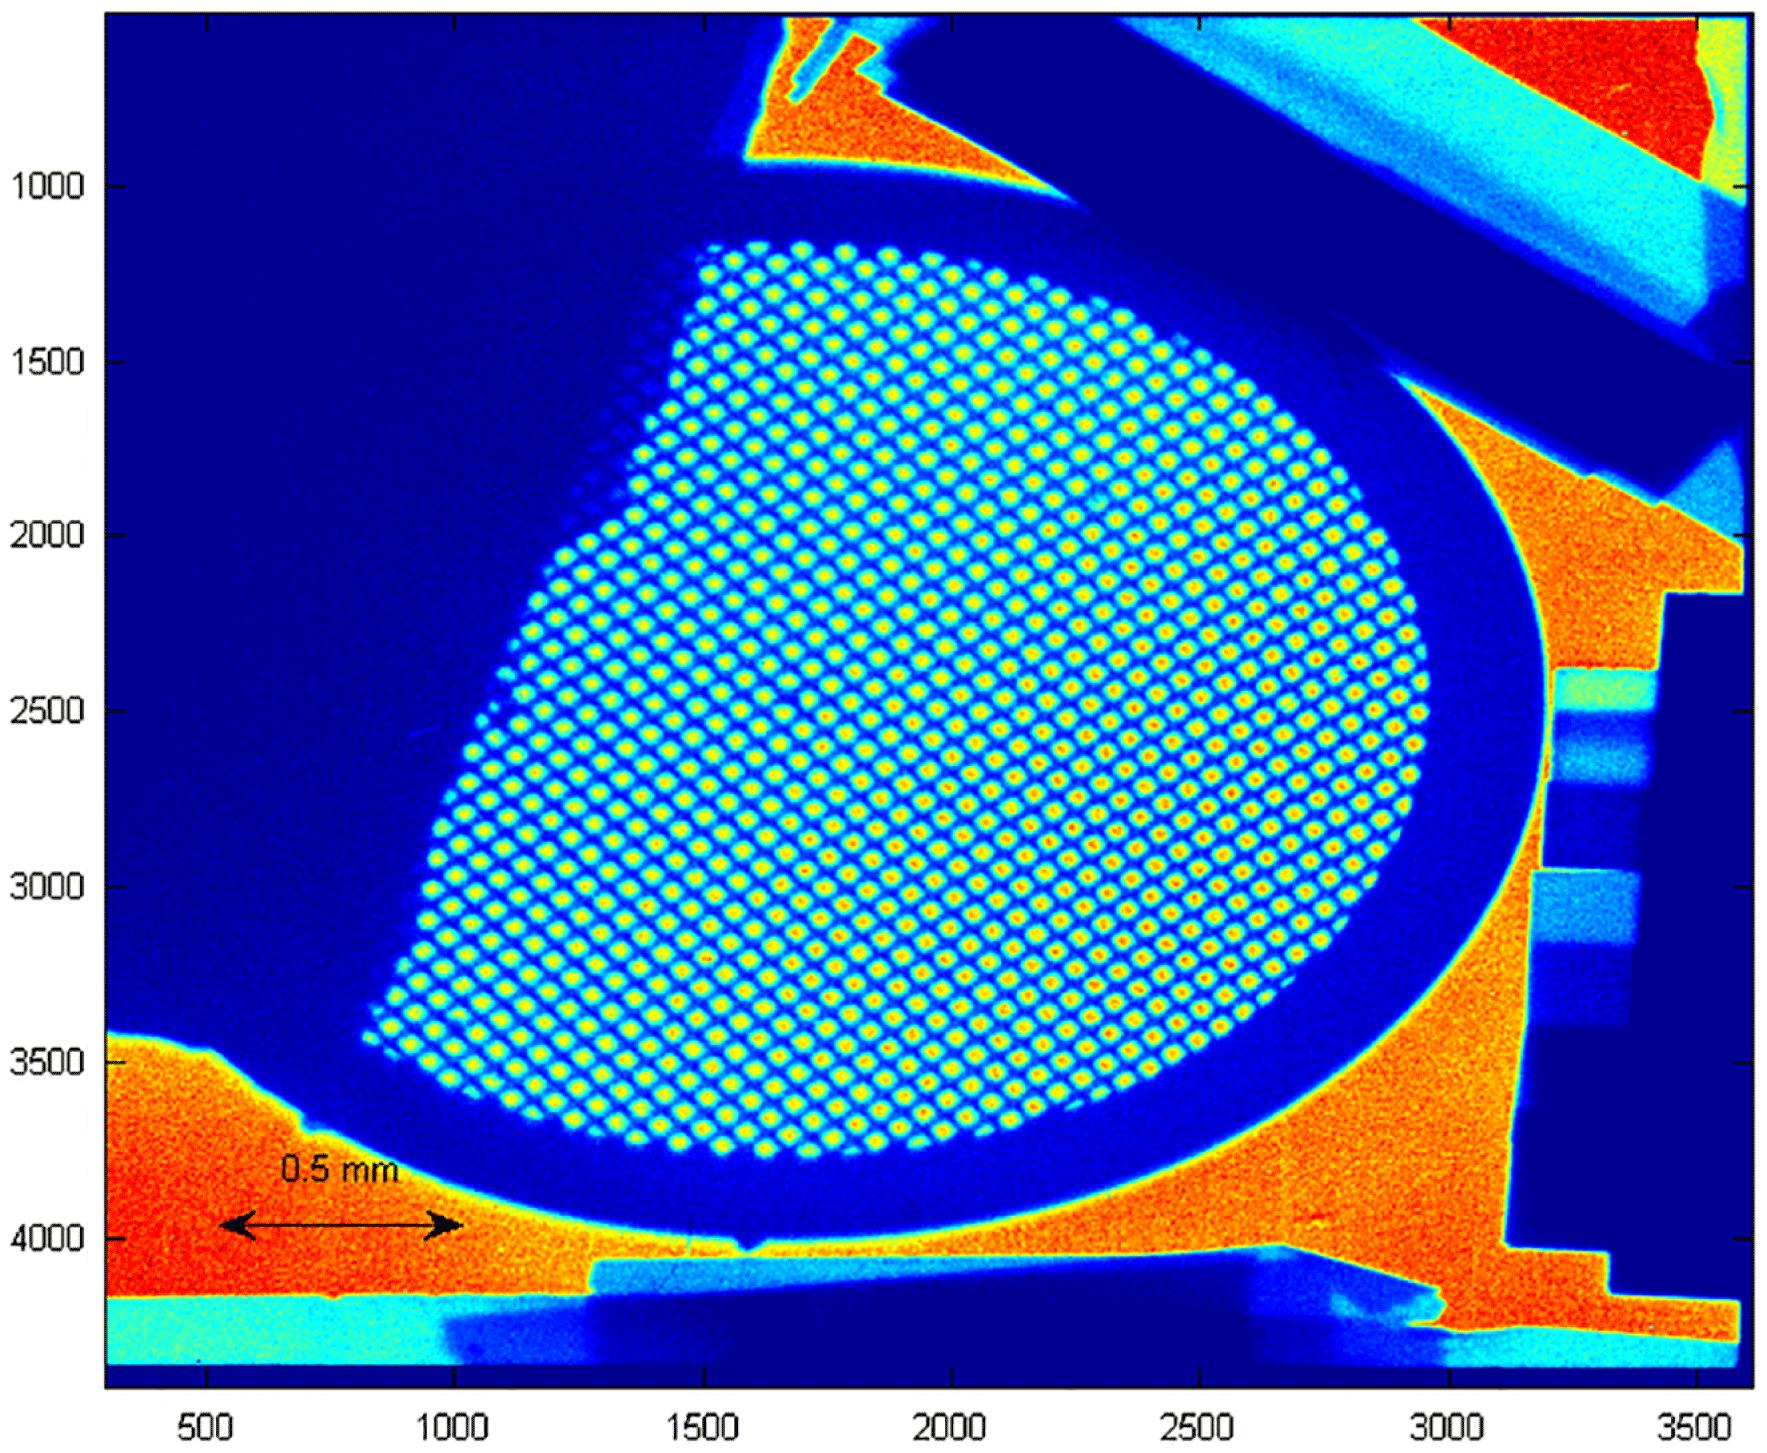
Fig. 2. Raw data of the radiography. The projected object is a 400 lpi gold grid. In addition, there are step targets of plastic and aluminum to estimate the dynamic resolution.
Fig. 3. V spectrum in function of the laser wavelength. The He-like lines are reduced compared to the $K_{\unicode[STIX]{x1D6FC}}$ line.
Fig. 4. Signal profile through the grid region, showing the unperturbed signal, the edge of the grid and the oscillations of the grid. Note the small variations of the signal over the detector.
Fig. 5. X-ray radiograph at 5.1 keV (V backlighter) taken 75 ns after the main drive beam.
| |||||||||||||||||||||||||
Table 1. Comparison of x-ray signals from different materials and for two laser wavelengths. The background is measured behind the edge of the gold grid.


Set citation alerts for the article
Please enter your email address

© Copyright 2018-2021 | Chinese Laser Press. All Rights Reserved 沪ICP备15018463号-20