• Photonics Research
  • Vol. 9, Issue 9, 1660 (2021)
Meng Deng1, Zichun Liao1, Yankai Chen1, Ningning Yang1, Xu Yan1, Chi Zhang1, Nengli Dai1、2、*, and Yi Wang1、3、*
Author Affiliations
  • 1Wuhan National Laboratory for Optoelectronics, Huazhong University of Science and Technology, Wuhan 430074, China
  • 2e-mail: dainl@hust.edu.cn
  • 3e-mail: ywangwnlo@mail.hust.edu.cn
  • show less
    DOI: 10.1364/PRJ.428050 Cite this Article Set citation alerts
    Meng Deng, Zichun Liao, Yankai Chen, Ningning Yang, Xu Yan, Chi Zhang, Nengli Dai, Yi Wang. On-chip ultrafast pulse generation based on graphene-silicon hybrid waveguides[J]. Photonics Research, 2021, 9(9): 1660 Copy Citation Text show less
    Hybrid graphene/silicon waveguide device. (a) Diagram of the GSHW. (b) Quasi-TE mode distribution of GSHW. It can be seen from (a) and (b) that graphene is located in the optical field region of the silicon waveguide and interacts with the evanescent wave. (c) SEM image of prepared GSHWs. Inset shows the patterned graphene on silicon waveguide. (d) Raman spectrum of monolayer graphene on silicon waveguide.
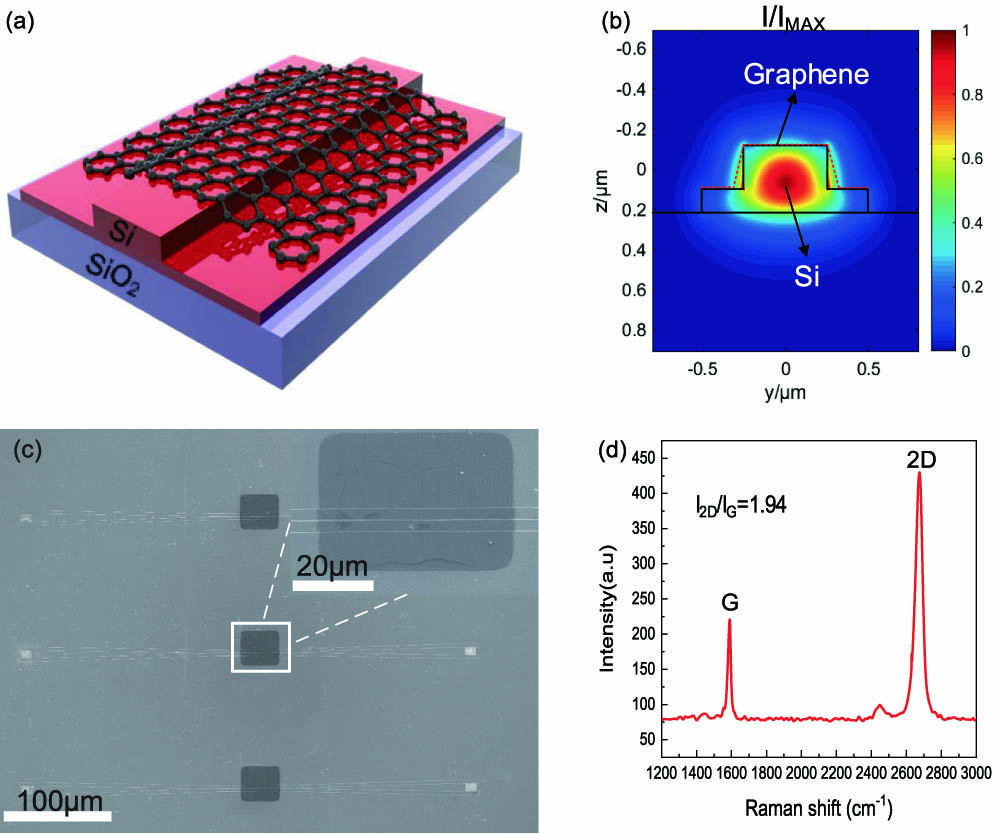
    Fig. 1. Hybrid graphene/silicon waveguide device. (a) Diagram of the GSHW. (b) Quasi-TE mode distribution of GSHW. It can be seen from (a) and (b) that graphene is located in the optical field region of the silicon waveguide and interacts with the evanescent wave. (c) SEM image of prepared GSHWs. Inset shows the patterned graphene on silicon waveguide. (d) Raman spectrum of monolayer graphene on silicon waveguide.
    Saturable absorption property of the GSHW. (a) Schematic of GSHW saturation absorption experiment setup. VOA represents the variable optical attenuator; PM is the power meter. (b) The transmittance as a function of the average optical power. The average power is the remaining input power by exclusion of the insertion loss of single-ended grating coupler. Experimental data are represented by black dots. The red solid line corresponds to a fit with a two-level saturable absorber model.
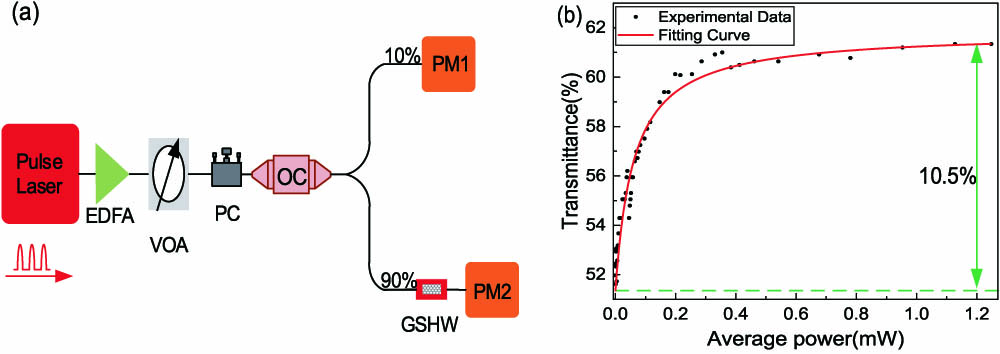
    Fig. 2. Saturable absorption property of the GSHW. (a) Schematic of GSHW saturation absorption experiment setup. VOA represents the variable optical attenuator; PM is the power meter. (b) The transmittance as a function of the average optical power. The average power is the remaining input power by exclusion of the insertion loss of single-ended grating coupler. Experimental data are represented by black dots. The red solid line corresponds to a fit with a two-level saturable absorber model.
    Schematic of mode-locked laser setup based on GSHW, where the GSHW acts as saturable absorber.
    Fig. 3. Schematic of mode-locked laser setup based on GSHW, where the GSHW acts as saturable absorber.
    Characteristics of passively mode-locked operation. (a) Laser output optical spectrum with 3 dB bandwidth of 3.57 nm. (b) Pulse train of fundamental mode-locked operation. Insert shows a pulse interval of 18.3 ns. (c) Autocorrelation trace of mode-locked operation. The experimental data are represented by black lines. Red curve represents fitting using a hyperbolic-secant function. The FWHM of the autocorrelation trace is 836 fs, corresponding to a pulse duration of 542 fs (a deconvolution factor of 0.648 is used to account for the hyperbolic-secant pulse shape). (d) The RF spectrum of the mode-locked pulses, corresponding to the repetition frequency of 54.37 MHz. Insert shows that the SNR is equal to 47 dB.
    Fig. 4. Characteristics of passively mode-locked operation. (a) Laser output optical spectrum with 3 dB bandwidth of 3.57 nm. (b) Pulse train of fundamental mode-locked operation. Insert shows a pulse interval of 18.3 ns. (c) Autocorrelation trace of mode-locked operation. The experimental data are represented by black lines. Red curve represents fitting using a hyperbolic-secant function. The FWHM of the autocorrelation trace is 836 fs, corresponding to a pulse duration of 542 fs (a deconvolution factor of 0.648 is used to account for the hyperbolic-secant pulse shape). (d) The RF spectrum of the mode-locked pulses, corresponding to the repetition frequency of 54.37 MHz. Insert shows that the SNR is equal to 47 dB.
    Ultrafast carrier response of graphene/silicon junction. (a) Schematic of the carrier response measurement setup with a pump–probe system. (b) The carrier response of GSHW under pump light. The blue solid line is the experimental measurement result. The falling edge of the experimental curve shows that the carrier relaxation recombination time of the graphene/silicon junction is as short as 1.82 ps. Illustration ① represents the carrier recombination state shown on the falling edge of the curve. Illustration ② shows the recombination state of photogenerated carriers in a pure silicon waveguide.
    Fig. 5. Ultrafast carrier response of graphene/silicon junction. (a) Schematic of the carrier response measurement setup with a pump–probe system. (b) The carrier response of GSHW under pump light. The blue solid line is the experimental measurement result. The falling edge of the experimental curve shows that the carrier relaxation recombination time of the graphene/silicon junction is as short as 1.82 ps. Illustration ① represents the carrier recombination state shown on the falling edge of the curve. Illustration ② shows the recombination state of photogenerated carriers in a pure silicon waveguide.
    Ref.αs [%]αNS [%]Saturable Pulse Energy [pJ]
    [27]1.731.93
    [28]1.334.3121.17
    [29]2135
    This work10.538.20.646
    Table 1. Saturable Absorption Parameters of Graphene-Related SA
    Meng Deng, Zichun Liao, Yankai Chen, Ningning Yang, Xu Yan, Chi Zhang, Nengli Dai, Yi Wang. On-chip ultrafast pulse generation based on graphene-silicon hybrid waveguides[J]. Photonics Research, 2021, 9(9): 1660
    Download Citation