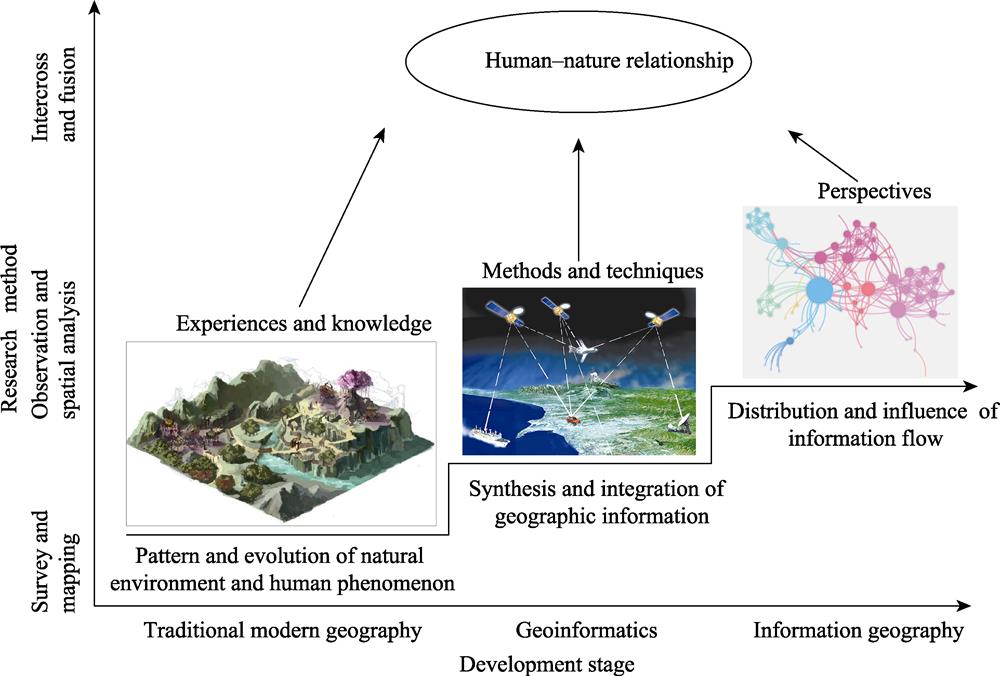
Assessment of social and economic
development | Nighttime light image | Investigation on the spatial patterns of economic recessions
(Li et al., 2014) |
| Identification and evolution analysis of urban agglomeration and urban system (Yu et al., 2014) |
| Analyses of the impact of urbanization on ecological environment (He et al., 2015) |
| Mobile phone metadata | Socioeconomic status and socioeconomic characteristic of
people were inferred (Blumenstock et al., 2015) |
| Remote sensing image | Population consumption and asset changes were predicted
(Jean et al., 2016) |
| Remote sensing image and online rental information | Poverty measurement of urban internal space (Yuan et al., 2018) |
| Street view image | The demographics and socioeconomic characteristics were estimated and voting trends in presidential elections were predicted (Fei-Fei L, 2017 ) |
Quantifying the street-visible greenery and estimating the
economic benefits that the neighbor visible greenery would
have on residential developments (Zhang and Dong, 2018) |
| High-speed railway and airline networks | The influence of high-speed railway and air networks on
urban system was analyzed (Yang et al., 2018) |
| Causal analysis of major social events | Nighttime light image | The impact of war was assessed (Witmer et al., 2011) |
| Monitoring humanitarian crises (Li et al., 2011) |
| The correlation between night light change and disaster loss in earthquake-stricken areas was analyzed (Zhang et al., 2018) |
| Assessing the impact of three types of natural disasters: earthquakes, floods, and storms (Zhao et al., 2018) |
Crowd activity in
large cities | Mobile phone data | The taxi demand characteristics and potential land use patterns between two places were revealed (Kang et al., 2013) |
Human mobility was speculated to improve traffic planning
and urban planning management (Zhu et al., 2015) |
| The disparities in park access were explored (Xiao et al., 2019) |
| Nighttime light image | The house vacancy rate was estimated. (Chen et al., 2015) |
| Nighttime light image and cancer registry data | There is a significant correlation between the intensity of light at night and the incidence of breast cancer. (Bauer et al., 2013) |
| Nighttime light image and taxi trajectories data | The nighttime light and taxi trajectory data were integrated to estimate population at micro levels. (Yu et al., 2019) |
Crowd activity in
large cities | Taxi trajectories data | The demand-supply of healthcare services was analyzed
(Chen et al., 2018) |
| Sharing bikes’ trajectories | Illegal parking behaviors were detected to ease traffic congestion
(He et al., 2018) |
| Transit smart card data | To discuss the influence of housing burden pressure on housing spatial distribution pattern (Li et al., 2018) |
| Social media data | The development trend and spatial distribution law of emergency events are mined to provide decision-making basis for disaster emergency response (Wang et al., 2016) |
| Street view image | Image detection methods are used to determine the presence of pedestrian and extract pedestrian count data (Li et al., 2015) |
| Examining associations between exposure to green and blue spaces as well as geriatric depression (Helbich et al., 2019) |
| Crime data | It reveals the spatial-temporal characteristics and influences of crimes, and predicts of space crimes (Liu et al., 2018) |
| Analysis of human activity in virtual space | Social media data | It extracts the public interest and attention to the event and predicts the reported disease level (Signorini et al., 2011) |
| It reveals the users who made political comments onsocial networking sites were mostly urban males (Barbera and Rivero., 2014) |
| The traveler’s family and workplace were estimated and the characteristics of human travel were depicted (Chang et al., 2017) |