
Deren LI, Wei GUO, Xiaomeng CHANG, Xi LI. From earth observation to human observation: Geocomputation for social science[J]. Journal of Geographical Sciences, 2020, 30(2): 233
- Journal of Geographical Sciences
- Vol. 30, Issue 2, 233 (2020)
Abstract
Keywords
1 Introduction
Geographers are often divided according to different schools of thought, specifically, those of spatial analysis and societal theory. The former focuses on the natural phenomena on earth’s surface, whereas the latter focuses on the continuous interactions between humans and their surrounding natural and built environments (
Geocomputation for social science emerged out of the need to adapt to the developments in both natural and built environments and the interactions between humans and with the environment. Earth observation technologies are transitioning to human observation, permitting the integration of social science and big data computation, providing new theories and methods for geographers to understand the deep coupling between environmental and human elements. We introduce the background of geocomputation for social science, discuss the definition and characteristics of the four disciplines included within geocomputation for social science, and review the research foci and development of the field. RS, Geographic Information Systems (GIS), and Global Navigation Satellite Systems (GNSS) are the three main vehicles for earth observation. The key technologies and value of their application in geocomputation for social science are presented using three case studies. These correspond to the geography of conflict (impact assessment of the Syrian Civil War), typhoon transits (transmission and evolution of social networks during a typhoon), and the monitoring and analysis of traffic patterns (intelligent transportation systems in Wuhan, China).
2 Geocomputation for social science
2.1 Evolution of modern geography
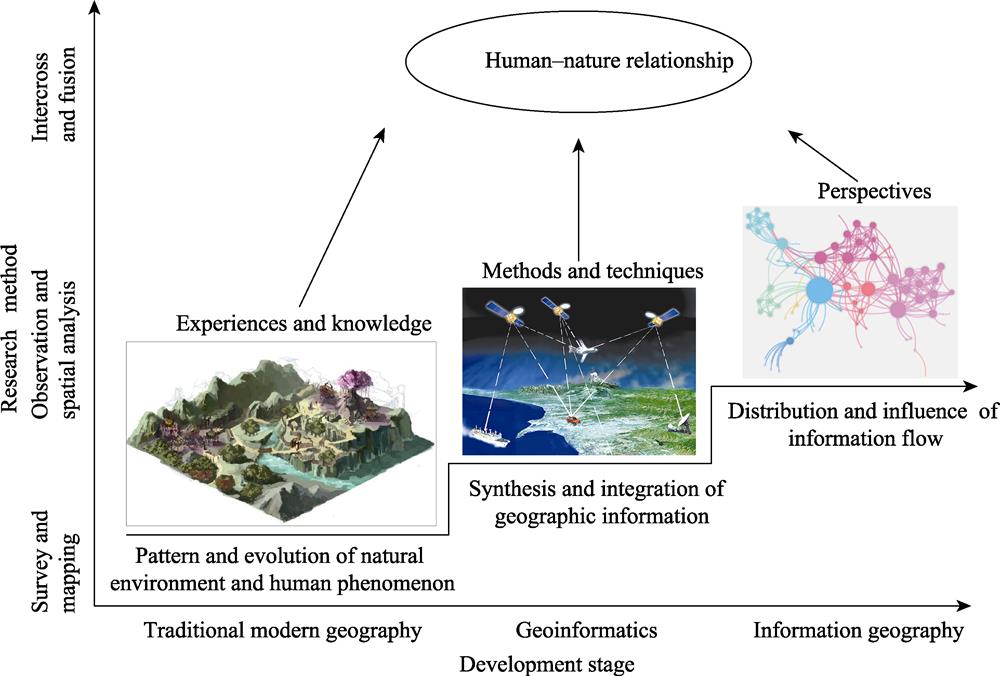
Since the 1950s, modern geography has evolved through three stages: (1) traditional modern geography, (2) geoinformatics, and (3) information geography (
![]()
Figure 1.
In the early (i.e., traditional) stage of modern geography, data on natural phenomena were acquired through surveying, observing, recording, mapping, and planning, whereas data on human activities and social phenomena were collected using questionnaires, interviews, and third-party observations. These data were then employed to understand the spatial differentiation and organization of various natural and human phenomena on the surface of the earth. However, studies on natural environmental characteristics and human activities were dominated by qualitative descriptions, and geographical research during this stage was macroscopic and empirical.
Economic geography, as an important branch of human geography, is defined as an interdisciplinary subject between geography and social science. It mainly studies the location and spatial organization of economic activities and their relationship with the geographical environment. Location is the place occupied by human activities (human behavior), and economic geography therefore mainly explores the general spatial law of human activities and studies the complex system of human-nature interactions. Questionnaire surveys or government statistical data are generally used to analyze and judge the combination of field research and theoretical analysis (
In the early 1960s, the emergence of GIS promoted the transition to geoinformatics. As a technical geographic science, geoinformatics comprises comprehensive and integrated scientific, technological, and industrial information that has proven useful for collecting, measuring, analyzing, storing, managing, displaying, disseminating, and applying data related to geographic and spatial patterns using various methods. Geoinformatics is an organic combination of surveying and mapping, photogrammetry and RS, cartography, GIS, computer graphics, satellite positioning technologies, expert system technologies, and modern communication technologies (
With the development of the information age, geographic research has increasingly focused on the practical problems of people and societies. The geographic problem of human communication is the main research direction in current information geography, and it aims to study the principles underlying human activities and social evolution by analyzing spatial distributions and structures and the spatial influence of human information flow. Furthermore, it provides a new perspective on the indirect observation of human activities in virtual spaces, which are composed of various information flows (
2.2 Definition of geocomputation for social science
Geocomputation for social science arose as a form of social computing, which was first proposed in information science (
Geocomputation for social science is a new discipline that employs RS earth observations and is driven by the spatiotemporal big data that reflects surface features and human activities. It senses, analyzes, and mines categories and intensities of human activities and their influences on natural and social environments in multiple spatial and temporal dimensions. The essence of geocomputation for social science is the human-nature relationship, which is also the main focus of geography. The field of geocomputation for social science is not only limited to the physical spaces of natural and built environments, but also extends to the virtual spaces of social environments. It contains the relationship structures of large-scale crowds in physical and virtual spaces, spatiotemporal interactive activities, spatiotemporal motion trajectories, and network activities.
The methodology underlying geocomputation for social science is shown in
![]()
Figure 2.
At present, both academics and industries have developed great interest in geocomputation for social science and, in turn, produced many creative studies and applications. By using deep learning, it is possible to mine vehicle information in Google Street View images and estimate the demographic structure and socioeconomic characteristics of American cities (Fei-Fei L et al., 2017). In this way, voting trends in a presidential election can be predicted, which provides a new method for the extensive transformation of traditionally labor-intensive social investigations. The spatiotemporal characteristics and influence of burglary crimes can also be revealed by correlation analyses among the characteristics of a person or community and crime distance (
On June 2, 2018, the satellite Luojia-1 was successfully launched from the Jiuquan Satellite Launch Center, Inner Mongolia, China. On June 4, 2018 at 11:25:34 a.m. (UTC+8), the first nighttime light RS image was successfully transmitted. Compared with common RS, which mainly observes the changes of earth’s surface and environment, nighttime light RS focuses on human-centered observations. As the first specialized nighttime light satellite in China, Luojia-1 is of groundbreaking importance to the development of nighttime light RS satellites and the application of RS in social and economic fields. Furthermore, in January 2018, Wuhan University, the University of Chicago, and the University of Michigan developed a joint research center for geocomputation for social science. The center is committed to studying the activities of human societies and uses human development as the main content. It focuses on the relationships between natural environments, social environments, and human activities and develops integrated innovations in the natural and social sciences to discern the characteristics and trends of human behavior and scientifically solve social problems.
Geocomputation for social science is a new means of understanding the principles underlying human activities and social phenomena. It will greatly promote crossover between and integration of natural and social sciences. Moreover, it provides a new direction in the development of modern geography and promotes the study of human-nature relationships at a deeper level.
2.3 Characteristics of geocomputation for social science
As the product of an interdisciplinary fusion of RS observation technology, social science, and big data computing methods, geocomputation for social science is a new discipline studying the principles and dynamics of human behaviors in space and over time. It is inherently multidimensional, with the core drive being the acquisition, input, and analysis of new spatiotemporal big data. Geocomputation for social science is characterized by four aspects: (1) new types of data, (2) the multidimensionality of space and time, (3) human activity rule mining and analysis, and (4) interdisciplinary integration.
2.3.1 New types of data
Currently, personal daily activities and urban development generate an overwhelming number of data. In the past, research on social topics mainly relied on questionnaire surveys or data from government statistics departments, international organizations, and media. Sociological statistical methods were then applied to describe and quantitatively analyze the data. This type of traditional data acquisition method has many deficiencies, such as high cost, low quality, poor reliability, and high processing times. It is especially difficult and less credible in countries with weak statistical monitoring or political instability. Therefore, this traditional approach has great limitations for the study of social problems.
New types of sensors, such as satellites, videos, mobile locations, and traffic trajectories, make data easier to collect and cheaper to store. It also promotes the leapfrog transformation of spatial analysis methods of modern geography from model- to data-driven. Traditional spatial analysis cannot effectively support the modeling and analysis of complex spatial processes and behaviors, because it relies heavily on the model’s quantitative assumptions about the degree of abstraction and parameter settings of the real world. With the support of real-time, multi-scale, high-precision sensor data, through the association, fusion, collision, and mining of multi-source data, it provides a new perspective for complex spatial analysis, which can use spatiotemporal big data mining methods to generate value, it also produced from objectively promoted the social geography. It has driven the emergence of geocomputation for social science.
Global socioeconomic development can be monitored by nighttime light RS. Statistical analyses have shown that there is a strong correlation between the spatial distribution of global gross domestic products (GDPs) and nighttime light. Thus, nighttime light RS can provide a new way of monitoring the dynamics of global socioeconomics (
2.3.2 Multidimensionality of space and time
Spatiotemporal characteristics are important attributes of geocomputation for social science that differ from traditional computational social science. By fusing spatiotemporal and big data, spatiotemporal big data contain the correlations of objects, processes, events in space, time, and semantics. These data have three basic characteristics: (1) the spatial dimension, (2) the attribute dimension, and (3) the time dimension. The spatial dimension refers to the geographic information with accurate three-dimensional spatial position (i.e., x-, y-, and z-coordinates) or spatial distribution characteristics, and it is measurable. The attribute dimension refers to special information that can been added with many attributes, and it is multidimensional. The time dimension refers to geographic information that changes over time, and it is dynamic (
2.3.3 Human activity rule mining and analysis
Rule mining and causal analysis of human activities is important in geocomputation for social science. All human activities take place in particular scenarios and are constrained by physical spaces, virtual spaces, and time (
2.3.4 Interdisciplinary integration
With the increasing popularity and accessibility of the internet, more social activities are occurring through this medium. Electronic traces, social media, digital texts, and spatial location information are the most representative social science big data. In sociology, attention is increasingly being paid to the application of information technology in social activities. Currently, geography focuses more on the observation of human activities, and the concept of geocomputation for social science was consequently generated. Geocomputation for social science is the integration of social data and theories in geography and spatial data and theories in sociology. Combining human-centered and social science theories with geospatial technologies will provide a theoretical and methodological system for studying human activities to understand and transform society and to solve complex social problems in political, economic, and cultural spheres.
3 Research foci of geocomputation in social science
The generation and development of new sensors provide new perspectives and methods for the study of human activities and social phenomena and, in turn, become the main data sources of geocomputation for social science. Based on the spatiotemporal big data that are closely related to human activities, various institutions and groups around the world have performed active explorations. Current research mainly focuses on four aspects: the assessment of social and economic development, causal analysis of major social events, crowd activity in large cities, and the characteristics of human activities in virtual spaces. The research foci of geocomputation in social science are shown in
| Research topics | Data type | Main results and conclusions |
|---|---|---|
| Assessment of social and economic development | Nighttime light image | Investigation on the spatial patterns of economic recessions ( |
| Identification and evolution analysis of urban agglomeration and urban system ( | ||
| Analyses of the impact of urbanization on ecological environment ( | ||
| Mobile phone metadata | Socioeconomic status and socioeconomic characteristic of people were inferred ( | |
| Remote sensing image | Population consumption and asset changes were predicted ( | |
| Remote sensing image and online rental information | Poverty measurement of urban internal space ( | |
| Street view image | The demographics and socioeconomic characteristics were estimated and voting trends in presidential elections were predicted (Fei-Fei L, 2017 ) | |
| Quantifying the street-visible greenery and estimating the economic benefits that the neighbor visible greenery would have on residential developments ( | ||
| High-speed railway and airline networks | The influence of high-speed railway and air networks on urban system was analyzed ( | |
| Causal analysis of major social events | Nighttime light image | The impact of war was assessed ( |
| Monitoring humanitarian crises (Li | ||
| The correlation between night light change and disaster loss in earthquake-stricken areas was analyzed ( | ||
| Assessing the impact of three types of natural disasters: earthquakes, floods, and storms ( | ||
| Crowd activity in large cities | Mobile phone data | The taxi demand characteristics and potential land use patterns between two places were revealed ( |
| Human mobility was speculated to improve traffic planning and urban planning management ( | ||
| The disparities in park access were explored ( | ||
| Nighttime light image | The house vacancy rate was estimated. ( | |
| Nighttime light image and cancer registry data | There is a significant correlation between the intensity of light at night and the incidence of breast cancer. ( | |
| Nighttime light image and taxi trajectories data | The nighttime light and taxi trajectory data were integrated to estimate population at micro levels. ( | |
| Research topics | Data type | Main results and conclusions |
| Crowd activity in large cities | Taxi trajectories data | The demand-supply of healthcare services was analyzed ( |
| Sharing bikes’ trajectories | Illegal parking behaviors were detected to ease traffic congestion ( | |
| Transit smart card data | To discuss the influence of housing burden pressure on housing spatial distribution pattern ( | |
| Social media data | The development trend and spatial distribution law of emergency events are mined to provide decision-making basis for disaster emergency response ( | |
| Street view image | Image detection methods are used to determine the presence of pedestrian and extract pedestrian count data ( | |
| Examining associations between exposure to green and blue spaces as well as geriatric depression ( | ||
| Crime data | It reveals the spatial-temporal characteristics and influences of crimes, and predicts of space crimes (Liu | |
| Analysis of human activity in virtual space | Social media data | It extracts the public interest and attention to the event and predicts the reported disease level ( |
| It reveals the users who made political comments onsocial networking sites were mostly urban males ( | ||
| The traveler’s family and workplace were estimated and the characteristics of human travel were depicted (Chang |
Table 1.
Research foci of geocomputation in social science
3.1 Assessment of social and economic development
It has been demonstrated that night lighting is strongly correlated with population density and GDP at different scales in socioeconomic parameter estimation, urbanization and regional development, and assessment of energy consumption monitoring. Nighttime light RS provides a new approach for the spatialization of social and economic indices. Defense Meteorological Satellite Program-Operational Linescan System (DMSP-OLS) data can be used for regression analysis between the area of night lighting and GDP in 21 American countries (
In especially poor areas, night lighting levels are usually very low and almost unchanging, which makes it difficult to study the living conditions of the poor by night lighting. To address this issue, a method of extracting socioeconomic information from high spatio-resolution satellite images for the estimation of consumer spending and asset wealth has been proposed (
3.2 Causal analysis of major social events
Nighttime light RS images can not only be used to monitor energy crises and natural disasters, but also to track the occurrence of large-scale humanitarian disasters. By using DMSP-OLS data, the impact of the war between Russia and Georgia in the Caucasus region in 2008 could be assessed (
3.3 Crowd activity in large cities
3.4 Analysis of human activity in virtual space
In recent years, location data based on services such as media data, which can dynamically reflect the characteristics of human activities, have been more widely used in geographical research. Such data are increasingly seen as sensors moving with people to perceive surrounding events. An emergency topic classification model was constructed for real-time micro-blog data (Wang et al., 2016). Valuable emergency information could be effectively identified and positioned from a large number of real-time texts. Spatiotemporal analyses are used to explore the evolution and spatial distribution of emergency events to provide data for emergency response. By effectively abstracting Twitter streams, with information on users’ views and responses, it is possible to measure public interest in and attention to health-related events and to accurately predict reported disease levels (
4 Case studies of geocomputation in social science
4.1 RS: Assessment of the impacts of the Syrian Civil War
At the beginning of 2011, the Syrian Civil War broke out. Many refugees were forced to flee their homes, were displaced, and lost their lives due to a lack of food and medical resources. At present, more than 400,000 people have died, and the country has been devastated. However, it is both necessary and difficult to produce a timely and accurate assessment of the impacts of the war. The conflict environment is too dangerous for journalists, and the objectivity and neutrality of their reports cannot necessarily be guaranteed. News reports do not comprehensively cover all issues. RS satellite imagery is an objective and accurate data source. To some extent, nighttime light images can be regarded as a representation of human activities and social economies. When the social and economic system of any place changes significantly due to a disaster, the nighttime light also fluctuates violently. Additionally, nighttime light has been widely used in assessing the impacts of war because of the low cost of nighttime light.
A research team at Wuhan University conducted an in-depth study on the impact of the Syrian Civil War using nighttime light images. After DMSP-OLS nighttime light images were calibrated, denoised, and automatically relatively radiometrically calibrated, a visual comparison of two periods of nighttime light images was conducted, and the changes in nighttime light in each province were statistically analyzed. The effects of the Syrian Civil War were objectively shown, and the correlation between changes in night lighting and number of refugees was analyzed (
![]()
Figure 3.
Spatial and temporal analyses of nighttime light images are important ways of evaluating the impacts of war.
![]()
Figure 4.
Nighttime light images play an important role in the assessment of the impact of the Syrian Civil War. They objectively and accurately reflect the extent of the destruction of the war in Syria and can help the global public to better understand the plight of the Syrian people. This finding has captured the attention of global officials and civil organizations on the ground in Syria and played a positive role in assisting Syrian refugees (
4.2 GIS: Social network transmission and evolution of typhoon transits
The propagation and evolution of social network events is the result of the joint action of events in virtual networks and real places. Events occur in a real space, spread in a virtual network space, and then spread through the wider, real-world society. Such a cycle repeats iteratively, promoting the development and extinction of events under the interaction of virtual networks and real spaces.
The spatiotemporal propagation of a super typhoon in physical space, after it became a focal topic in social network space, has been studied using micro-blog data.
![]()
Figure 5.
4.3 GNSS: Smart traffic supervision platform in Wuhan
Traffic congestion is an important issue in the process of urban motorization and modernization. It greatly reduces the efficiency of urban operations and poses severe challenges to the sustainable development of cities. A smart traffic supervision platform in Wuhan, built by the research team of Wuhan University on the basis of “internet + big data,” has been effective in solving urban traffic problems. A new mode of daily operation supervision and emergency disposal of traffic systems was constructed, and it enabled the comprehensive monitoring of people, vehicles, roads, enterprises, and the environment.
As shown in
![]()
Figure 6.
If water cannot be discharged in time during heavy rains, traveling is affected, which causes traffic congestion and possibly water and power outages. Many social problems caused by the untimely treatment of rainfall disasters have limited the social stability and economic development of cities to some extent. As shown in
![]()
Figure 7.
Drugged and drunk driving is prohibited for motor vehicle drivers. These activities present hidden dangers and are a frequent cause of road accidents. The Wuhan smart traffic supervision platform can access information of high-risk vehicles and use video monitoring, face recognition, vehicle recognition, and other technologies to conduct real-time monitoring of the illegal behaviors of drivers, such as drugged and drunk driving. Warnings are issued once the dangerous driver has been identified on the road. The police can immediately arrest suspects after they determine their primary activity areas, travel tracks, and vehicle locations. At present, a number of illegal activities have been successfully detected, thus improving social security (
5 Conclusions
The emergence and development of mobile internet and various other new observation sensors have profoundly changed the lifestyles of people around the world, providing new ideas for people to observe their own activities and study the evolution of society. Previous earth observations have increasingly failed to meet the demand for human observations in the real world, and society has entered an era in which progress from earth observations to human observations is needed. The massive number of spatiotemporal big data that are intimately linked to human activities is both an opportunity and a challenge to make better use of these data. In the future, more social problems may be solved by means of geocomputation for social science, in which the deeper intersection and integration of the natural and social sciences is promoted from the perspective of geography. Integrated research using geospatial informatics in the natural and social sciences will promote the sustainable development of human societies and nature.
References
[1] J Bao, T He, S Ruan et al. Planning bike lanes based on sharing-bikes’ trajectories. In: KDD ’17 Proceedings of the 23rd ACM SIGKDD International Conference on Knowledge Discovery and Data Mining. New York: ACM, 1377-1386(2017).
[2] P Barbera, G Rivero. Understanding the political representativeness of Twitter users. Social Science Computer Review, 33, 712-729(2014).
[4] J Blumenstock, G Cadamuro, R On. Predicting poverty and wealth from mobile phone metadata. Science, 350, 1073-1076(2015).
[5] Y M Chen, B B Wang, X P Liu et al. Mapping the spatial disparities in urban health care services using taxi trajectories data. Transactions in GIS, 22, 602-615(2018).
[6] Z Q Chen,, B L Yu, Y J Hu et al. Estimating house vacancy rate in metropolitan areas using NPP-VIIRS nighttime light composite data. IEEE Journal of Selected Topics in Applied Earth Observations and Remote Sensing, 8, 2188-2197(2015).
[8] M Diao, Y Zhu, Jr J Ferreira et al. Inferring individual daily activities from mobile phone traces: A Boston example. Environment and Planning B-Planning & Design, 43, 920-940(2015).
[9] C D Elvidge, K E Baugh, E A Kihn et al. Relation between satellite observed visible-near infrared emissions, population, economic activity and electric power consumption. International Journal of Remote Sensing, 18, 1373-1379(1997).
[10] J Fan. Perspective on the development process of Human-Economic Geography and regional development studies: On the evolution of the field in the Institute of Geographic Sciences and Natural Resources Research of CAS. Progress in Geography, 30, 387-396(2011).
[11] Q Gao, Q Li, Y Yue et al. Exploring changes in the spatial distribution of the low-to-moderate income group using transit smart card data. Computers, Environment & Urban Systems, 72, 68-77(2018).
[12] T Gebru, J Krause, Y Wang et al. Using deep learning and Google Street View to estimate the demographic makeup of neighborhoods across the United States. Proceedings of the National Academy of Sciences of the United States of America, 114, 13108-13113(2017).
[13] R G Golledge, R J Stimson. Spatial Behavior: A Geographic Perspective, 620(1997).
[14] C Y He, Z F Liu, J Tian et al. Urban expansion dynamics and natural habitat loss in China: A multiscale landscape perspective. Global Change Biology, 20, 2886-2902(2014).
[15] T F He, J Bao, R Y Li et al. Detecting vehicle illegal parking events using sharing bikes’ trajectories. In: KDD ‘18 Proceedings of the 24th ACM SIGKDD International Conference on Knowledge Discovery & Data Mining. New York: ACM, 340-349(2018).
[16] M Helbich, Y Yao, Y Liu et al. Using deep learning to examine street view green and blue spaces and their associations with geriatric depression in Beijing, China. Environment International, 126, 107-117(2019).
[17] N Jean, M Burke, M Xie et al. Combining satellite imagery and machine learning to predict poverty. Science, 353, 790-794(2016).
[18] C Kang, S Sobolevsky, Y Liu et al. Exploring human movements in Singapore: A comparative analysis based on mobile phone and taxicab usages. In: The 19th ACM SIGKDD International Conference on Knowledge Discovery and Data Mining. Chicago, IL(2013).
[19] D Lazer, A Pentland, L Adamic et al. Computational social science. Science, 323, 721-723(2009).
[20] D Li. On the formation of geomatics and its cross-century development. World Sci-Tech R & D, 5, 1-8(1996).
[21] D Li, X Li. An overview on data mining of nighttime light remote sensing. Acta Geodaeticaet Cartographica Sinica, 44, 591-601(2015).
[22] D Li, J Ma, Z Shao. The application of spatial temporal big data. Satellite Application, 9, 7-11(2015).
[23] D Li, X Zhao, X Li. Remote sensing of human beings: A perspective from nighttime light. Geo-spatial Information Science, 19, 69-79(2016).
[24] X Li, D Li. Can night-time light images play a role in evaluating the Syrian Crisis?. International Journal of Remote Sensing, 35, 6648-6661(2014).
[26] P A Longley, M F Goodchild, D J Maguire et al. Geographic Information Systems: Principles, Techniques, Management and Applications. 2nd ed. New York: John Wiley & Sons, 401(2005).
[27] L McDowell. Understanding diversity: The problem of theory. In: Johnston R J, Taylor P J, Watts M J (eds.), Geographies of Global Change: Remapping the World in the Late Twentieth Century. Oxford: Blackwell, 280-294(1995).
[28] D Schuler. Social computing. Communications of the ACM, 37, 28-29(1994).
[30] W Tu, J Cao, Y Yue et al. Coupling mobile phone and social media data: A new approach to understanding urban functions and diurnal patterns. International Journal of Geographical Information Science, 31, 2331-2358(2017).
[31] Y D Wang, H Li, T Wang et al. Modeling urban air quality trend surface using media data. Geomatics and Information Science of Wuhan University, 42, 14-20(2017).
[32] R E Williams. Selling a geographical information system to government policy makers. Papers from the 1987 Annual Conference of the Urban and Regional Information Systems Association. Des Plaines, IL: Urisa(1987).
[33] F W Witmer, J O Loughlin. Detecting the effects of wars in the Caucasus regions of Russia and Georgia using radiometrically normalized DMSP-OLS nighttime lights imagery. GIScience & Remote Sensing, 48, 478-500(2011).
[36] Y Xiao, D Wang, . Exploring the disparities in park access through mobile phone data: Evidence from Shanghai, China. Landscape and Urban Planning, 181, 80-91(2019).
[37] H R Yang, F Dobruszkes, J E Wang et al. Comparing China’s urban systems in high-speed railway and airline networks. Journal of Transport Geography, 68, 233-244(2018).
[38] L Yin, Q M Cheng, Z X Wang et al. ‘Big data’ for pedestrian volume: Exploring the use of Google Street View images for pedestrian counts. Applied Geography, 63, 337-345(2015).
[39] B L Yu, T Lian, Y X Huang et al. Integration of nighttime light remote sensing images and taxi GPS tracking data for population surface enhancement. International Journal of Geographical Information Science, 33, 687-706(2019).
[40] B L Yu, S Shu, H X Liu et al. Object-based spatial cluster analysis of urban landscape pattern using nighttime light satellite images: A case study of China. International Journal of Geographical Information Science, 28, 2328-2355(2014).
[41] H Yu, S-L Shaw. Exploring potential human activities in physical and virtual spaces: A spatio-temporal GIS approach. International Journal of Geographical Information Science, 22, 409-430(2008).
[42] Y Yuan, J Liu, Y M Chen et al. Poverty measurement of urban internal space based on remote sensing images and online rental information: A case study of the city core of Guangzhou. Human Geography, 33, 60-67(2018).
[43] B J Zhang. Analysis of the inter-annual variation of nighttime lights in the most affected area of Wenchuan earthquake from 2003 to 2013. Journal of Catastrophology, 33, 12-18(2018).


Set citation alerts for the article
Please enter your email address

© Copyright 2018-2021 | Chinese Laser Press. All Rights Reserved 沪ICP备15018463号-20