
Chi Zhang, Qinghao Meng, Tao Jing. Video Flame Detection Algorithm Based on Improved GMM and Multi-Feature Fusion[J]. Laser & Optoelectronics Progress, 2021, 58(4): 0410006
- Laser & Optoelectronics Progress
- Vol. 58, Issue 4, 0410006 (2021)
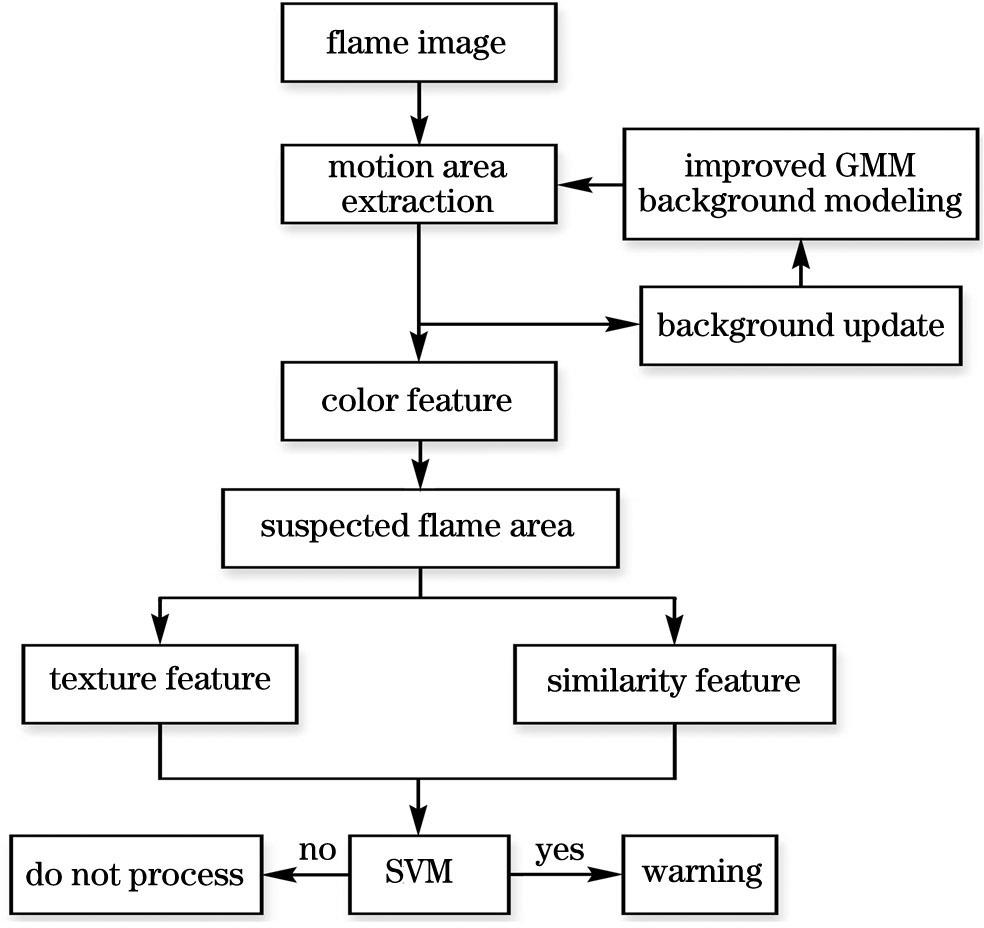
Fig. 1. Detection flowchart based on improved GMM and multi-feature fusion
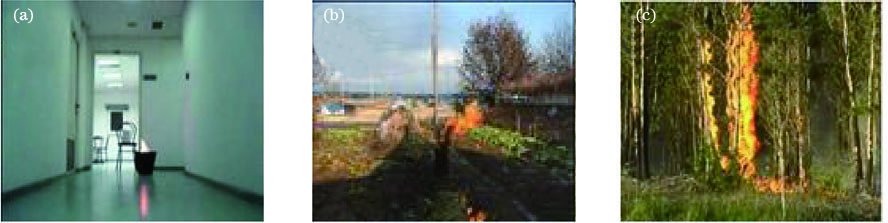
Fig. 2. Frame capture of flame video sequence. (a) Indoor flame; (b) outdoor flame; (c) forest flame
Fig. 3. Original and foreground renderings.(a)(b) Original image; (c)(d) traditional GMM foreground extraction map; (e)(f) improved GMM foreground extraction map
Fig. 4. Feature extraction flowchart
Fig. 5. Original images and LBP histograms. (a)(b) Flame images; (c)(d) fire-like images; (e) histogram extracted from Fig. (a); (f) histogram extracted from Fig. (b); (g) histogram of extracted from Fig. (c); (h) histogram of extracted from Fig. (d)
Fig. 6. Experimental videos. (a) Outdoor flame; (b) indoor flame; (c) forest flame; (d) walking pedestrians; (e) flashing car lights; (f) flashing neon lights
|
Table 1. Comparison of algorithm processing speed unit: ms/frame
|
Table 2. Comparison of false alarms
|
Table 3. Comparison of missed inspections
|
Table 4. Target similarity comparison
| |||||||||||||||||||||||||||||||||||||||||||||||||||||||||||||||
Table 5. Comparison of flame video detection results
| |||||||||||||||||||||||||||||||||||||||||||||||||||||||||||||||
Table 6. Comparison of non-fire video detection results


Set citation alerts for the article
Please enter your email address

© Copyright 2018-2021 | Chinese Laser Press. All Rights Reserved 沪ICP备15018463号-20