
Daxiang Li, Zhen Zhang. Improved U-Net Segmentation Algorithm for the Retinal Blood Vessel Images[J]. Acta Optica Sinica, 2020, 40(10): 1010001
- Acta Optica Sinica
- Vol. 40, Issue 10, 1010001 (2020)
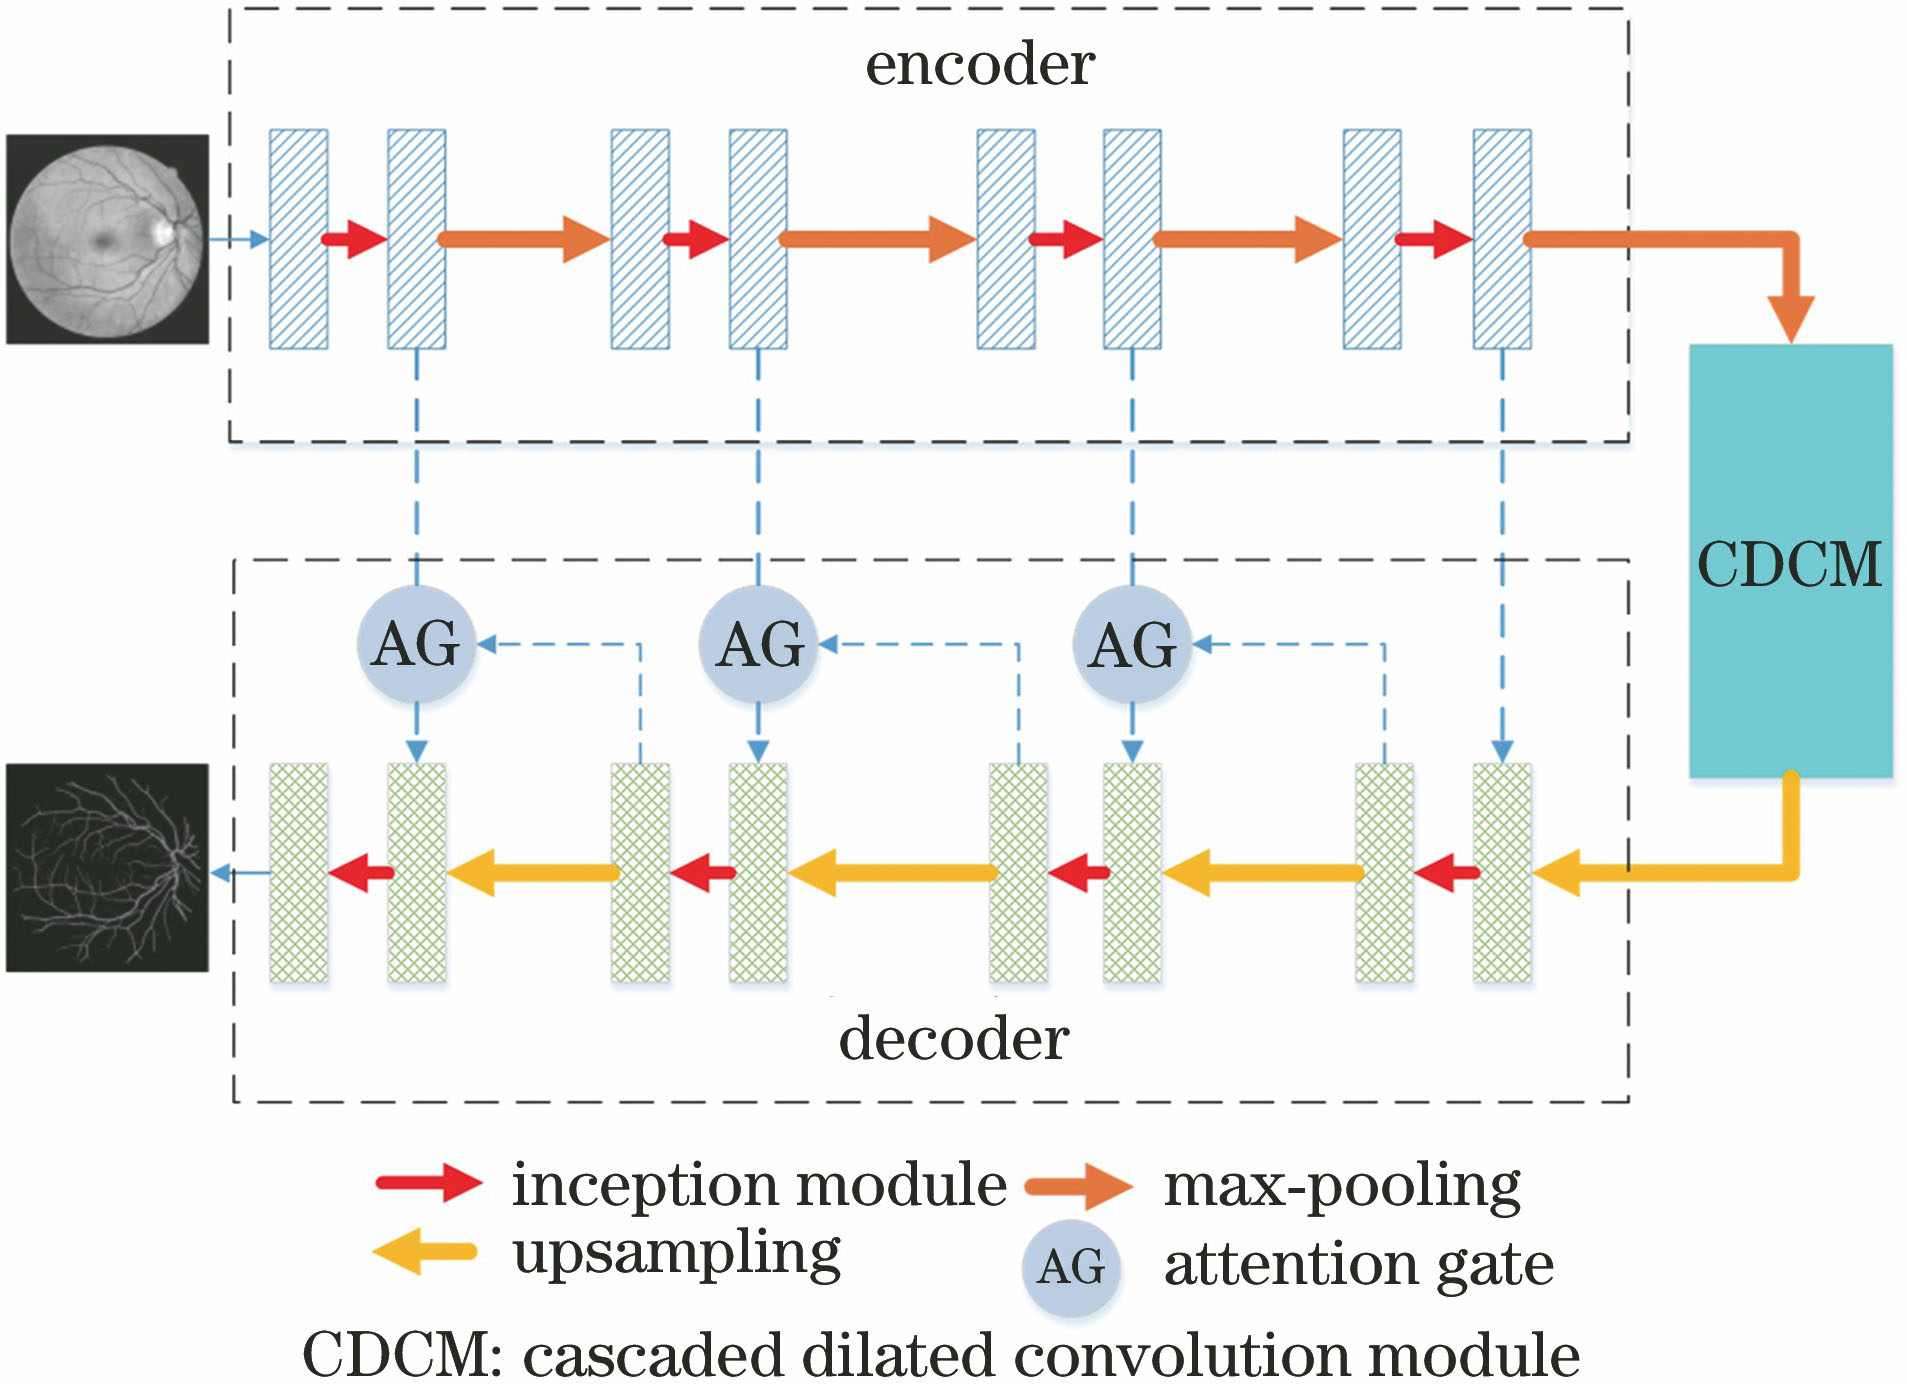
Fig. 1. Improved U-Net retinal vessel segmentation algorithm model
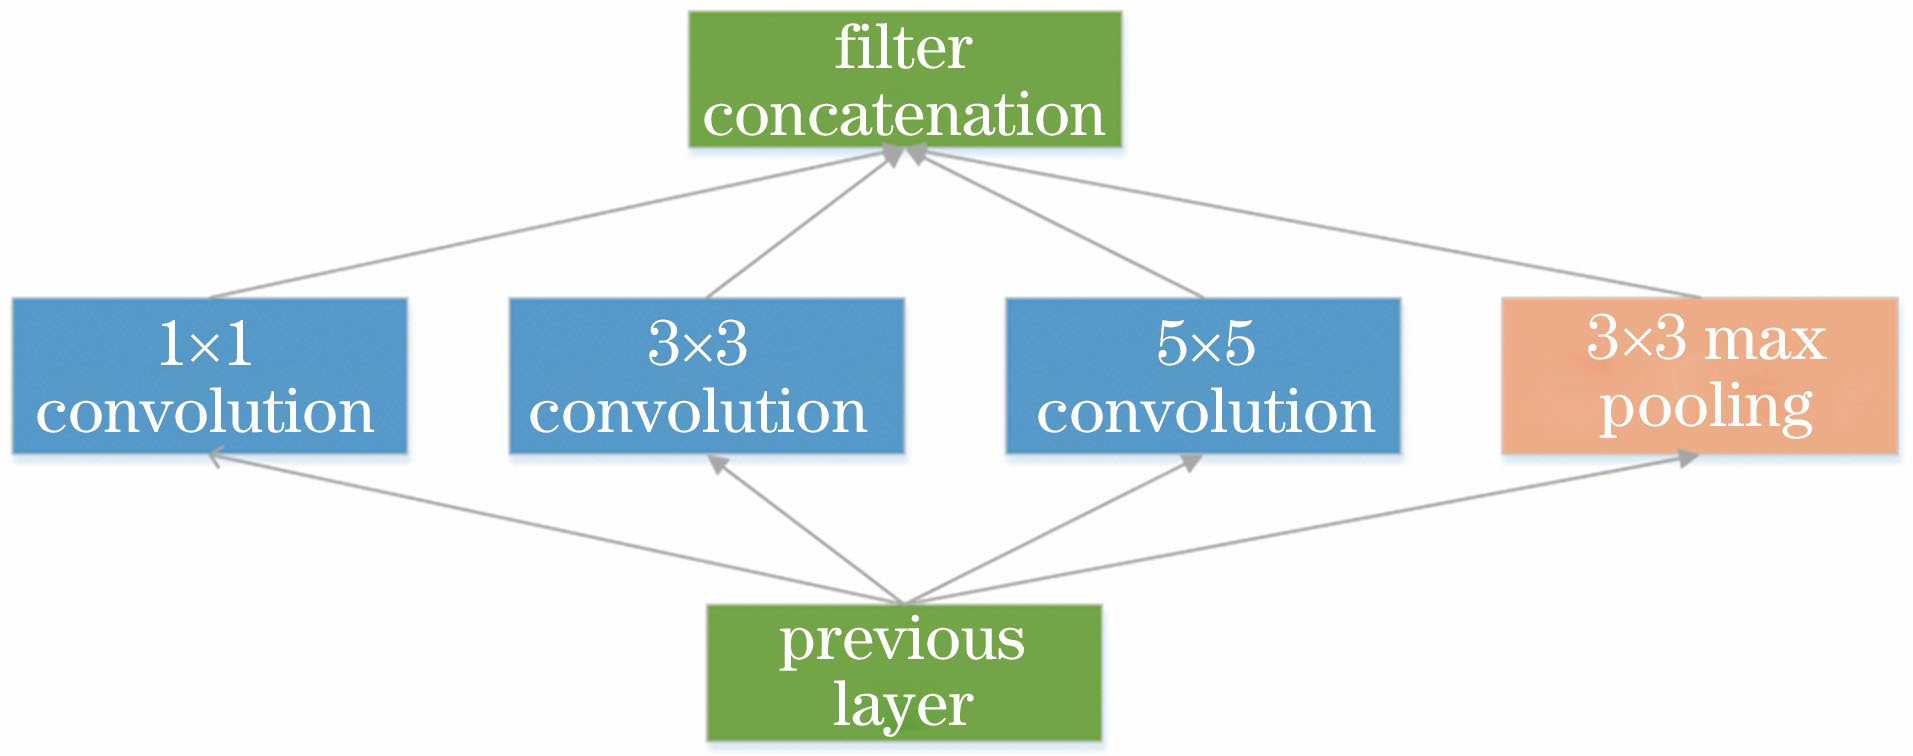
Fig. 2. Classic Inception structure
Fig. 3. Inception module
Fig. 4. Schematic diagram of hole convolution under different expansion rates r. (a) r=1;(b) r=2;(c) r=4
Fig. 5. Schematic diagram of cascaded dilated convolution module
Fig. 6. Internal structure of attention mechanism
Fig. 7. DRIVE dataset (from left to right are the original color fundus image, two expert manual segmentation images, and binary mask image)
Fig. 8. Retina image preprocessing. (a) Original image of the DRIVE dataset; (b) pre-processed image
Fig. 9. Local blocky information map of retinal blood vessels. (a) Block information of the DRIVE dataset; (b) standard block information
Fig. 10. Segmentation of experimental results. (a) Original image preprocessing map; (b) image segmentation standard map; (c) experimental result segmentation map
Fig. 11. Partial blood vessel region segmentation diagram. (a) Original color fundus retinal images; (b) locally fundus retinal images; (c) local standard retinal segmentation images; (d) local retinal segmentation result images
Fig. 12. Comparison of evaluation indexes of different algorithms
|
Table 1. Comparison of test results of different algorithms on the DRIVE dataset
|
Table 2. Comparison of test results of different network structures on the DRIVE dataset

Set citation alerts for the article
Please enter your email address
© Copyright 2018-2021 | Chinese Laser Press. All Rights Reserved 沪ICP备15018463号-20