• Acta Physica Sinica
  • Vol. 69, Issue 9, 090202-1 (2020)
Ying-Ke Li1、*, Shi Zhao2, Yi-Jun Lou3, Dao-Zhou Gao4, Lin Yang5, and Dai-Hai He3、*
Author Affiliations
  • 1College of Mathematics and Physics, Xinjiang Agriculture University, Urumqi 830052, China
  • 2JC School of Public Health and Primary Care, The Chinese University of Hong Kong, Hong Kong 999077, China
  • 3Department of Applied Mathematics, Hong Kong Polytechnic University, Hong Kong 999077, China
  • 4Department of Mathematics, Shanghai Normal University, Shanghai 200234, China
  • 5School of Nursing, Hong Kong Polytechnic University, Hong Kong 999077, China
  • show less
    DOI: 10.7498/aps.69.20200389 Cite this Article
    Ying-Ke Li, Shi Zhao, Yi-Jun Lou, Dao-Zhou Gao, Lin Yang, Dai-Hai He. Epidemiological parameters and models of coronavirus disease 2019[J]. Acta Physica Sinica, 2020, 69(9): 090202-1 Copy Citation Text show less
    (a) Daily new cases simulated versus reporting; (b) daily reporting rate
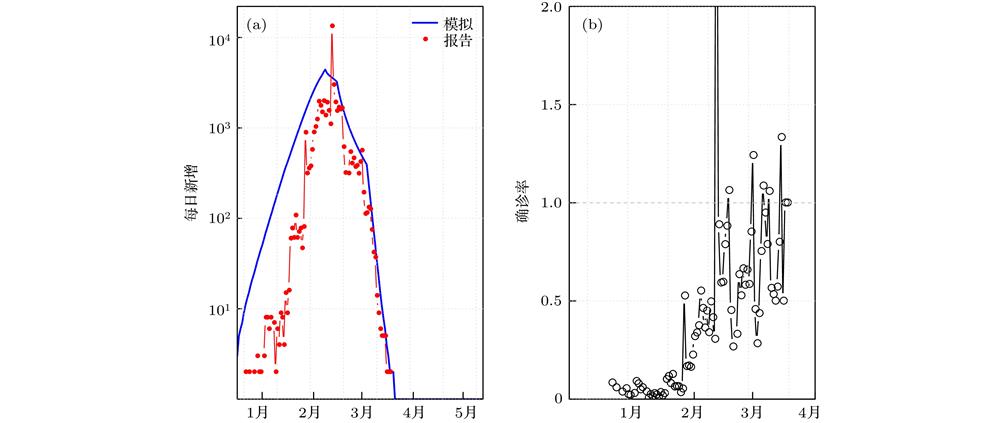
    Fig. 1. (a) Daily new cases simulated versus reporting; (b) daily reporting rate
    Curves of daily confirmed cases and instantaneous reproductive number of the top 20 countries with the most cumulative cases
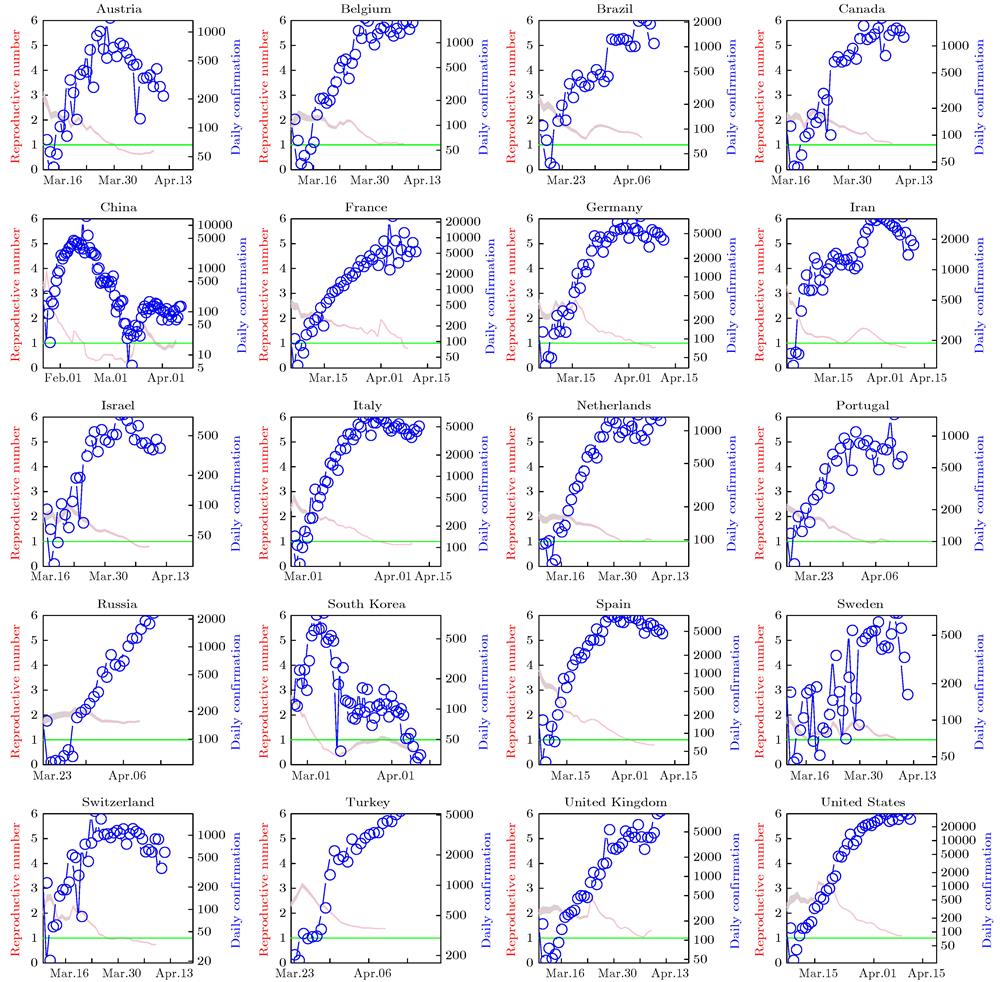
    Fig. 2. Curves of daily confirmed cases and instantaneous reproductive number of the top 20 countries with the most cumulative cases
    Curves of daily confirmed cases and instantaneous reproductive number of the 21st − 40th countries with the most cumulative cases.
    Fig. 3. Curves of daily confirmed cases and instantaneous reproductive number of the 21st − 40th countries with the most cumulative cases.
    模型或分布公式参数介绍
    $\rm {SIR}$模型 $ {\cal{R} }_{0}=1+ {r}/{b} $r为增长率, b为移出率
    ${\rm {SEIR}}$模型 ${\cal{R} }_{0}=\left(1+ {r}/{b_1}\right)\left(1+ {r}/{b_2}\right)$$b_1, $$ b_2$分别为从E, I的移出率
    多阶段暴露 与感染模型 ${\cal{R} }_{0}=\dfrac{\left(1+\dfrac{r}{b_1}\right)^x}{\displaystyle\sum\limits_{i=1}^{y}\left(1+\dfrac{r}{b_2}\right)^{-i} }$$b_1, $$b_2$为暴露x, 感染 y阶段移出率
    正态分布${\cal{R} }_{0}=\exp\left(rT_{\rm c}-\dfrac{1}{2}r^2\sigma^2\right)$$T_{\rm c}$为代间隔均值, $\sigma$为方差
    德尔塔分布${\cal{R} }_{0}={\rm e}^{rT_{\rm c}}$$T_{\rm c}$为代间隔均值
    经验分布${\cal{R} }_{0}=\dfrac{r}{\displaystyle\sum\limits_{i=1}^{n}y_i\dfrac{ {\rm e }^{-ra_{i-1} }-{\rm e}^{-ra_i} }{a_i-a_{i-1} } }$ai$y_i$分别表示年龄与相应频率
    Table 1. The formula of the basic reproduction number under different models or distributions.
    地点${\cal{R}}_0$置信区间截止时间计算方法参考文献
    注: 表2表4中参考文献数据均来自国家卫健委、湖北卫健委、中国CDC等网站及已发表文献.
    武汉市2.2[1.40, 2.20]2020/01临床诊断推断[2]
    武汉市2.68[2.47, 2.86]2020/01/28MCMC[3]
    武汉市4.082020/01/26有效再生数 ${\cal{R}}_{\rm{e}}$[5]
    武汉市3.0[0.75, 7.80]2020/01/24统计推断[16]
    武汉市6.47[5.71, 7.23]2020/01/15统计推断[17]
    武汉市2.56[2.49, 2.63]2020/01/24极大似然[18]
    武汉市2.32020/01/24有效再生数 ${\cal{R}}_{\rm{e}}$[19]
    武汉市2.23[1.77, 3.00]2020/01/24有效再生数 ${\cal{R}}_{\rm{e}}$[20]
    武汉市7.05[6.11, 8.18]2020/02/08最大似然[21]
    湖北省2.56[4.70, 6.60]2020/01/25SEIR仓室模型[22]
    武汉市2.24[1.96, 2.25]2020/01/24极大似然[23]
    Table 2. Summary of the basic reproduction number for COVID-19.
    点估计置信区间分布形式截止时间估计方法参考文献
    注: M: n表示均值是n天, Me: n表示中位数是n天. 表4含义表示相同.
    M: 5.2 [4.1, 7.0]指数增长2020/01/22[1]
    M: 6.4 [5.6, 7.7]威布尔2020/01/29贝叶斯[6]
    M: 5.0 [4.2, 6.0]对数正态2020/01/23最优化[7]
    Me: 5.2 [4.4, 6.0]对数正态2020/01/30最优化[7]
    Me: 4.0 经验分布2020/01/29非参数估计[11]
    Table 3. Summary of the incubation period for COVID-19.
    时间/d置信区间截止时间估计方法参考文献
    M: 7.5 [5.3, 19.0]2020/01最优化[1]
    M: 4.41 2020/02/02最优化[24]
    M: 4.7 [3.7, 6.0]2020/02最优化[25]
    Table 4. Summary of the serial interval for COVID-19.
    Ying-Ke Li, Shi Zhao, Yi-Jun Lou, Dao-Zhou Gao, Lin Yang, Dai-Hai He. Epidemiological parameters and models of coronavirus disease 2019[J]. Acta Physica Sinica, 2020, 69(9): 090202-1
    Download Citation