• Chinese Optics Letters
  • Vol. 20, Issue 3, 033401 (2022)
Haipeng Zhang1、2、3, Ke Li2, Feixiang Wang2, Hong Yu4, Changzhe Zhao1、2、3, Guohao Du2, Zhongliang Li2, Biao Deng2, Honglan Xie2, Shensheng Han4, and Tiqiao Xiao1、2、3、*
Author Affiliations
  • 1Shanghai Institute of Applied Physics, Chinese Academy of Sciences, Shanghai 201800, China
  • 2Shanghai Synchrotron Radiation Facility/Zhangjiang Lab, Shanghai Advanced Research Institute, Chinese Academy of Sciences, Shanghai 201204, China
  • 3University of Chinese Academy of Sciences, Beijing 100049, China
  • 4Shanghai Institute of Optics and Fine Mechanics, Chinese Academy of Sciences, Shanghai 201800, China
  • show less
    DOI: 10.3788/COL202220.033401 Cite this Article Set citation alerts
    Haipeng Zhang, Ke Li, Feixiang Wang, Hong Yu, Changzhe Zhao, Guohao Du, Zhongliang Li, Biao Deng, Honglan Xie, Shensheng Han, Tiqiao Xiao. Megapixel X-ray ghost imaging with a binned detector in the object arm[J]. Chinese Optics Letters, 2022, 20(3): 033401 Copy Citation Text show less
    Scheme of experimental setup for synthetic aperture X-ray ghost imaging (SAXGI), showing the reference arm and object arm.
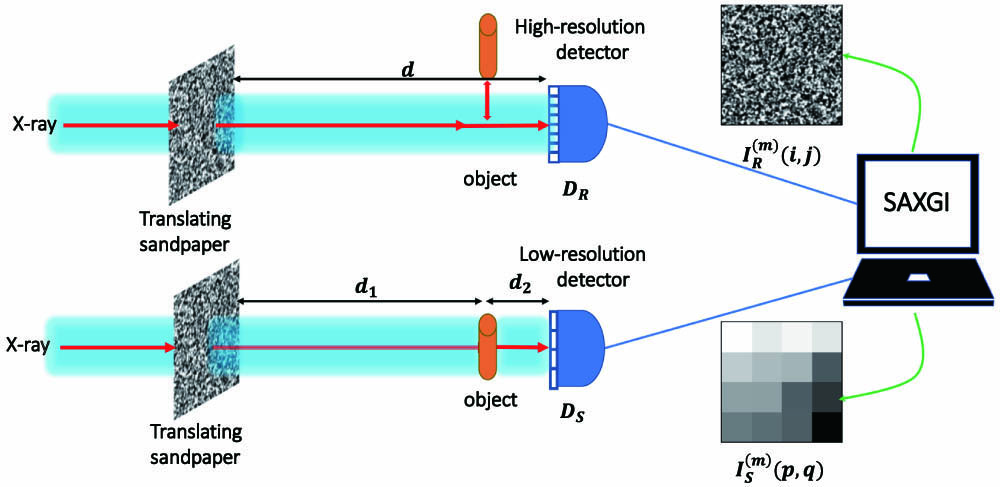
    Fig. 1. Scheme of experimental setup for synthetic aperture X-ray ghost imaging (SAXGI), showing the reference arm and object arm.
    Simulation results for the effect of block size on the restored images by SAXGI. (a) Target image. (b), (c), (d) Restored images at square block sizes of 20, 40, and 60, respectively, using a sampling rate of 30%. (e) Peak signal-to-noise ratio (PSNR) of the restored images versus block size at different sampling rates.
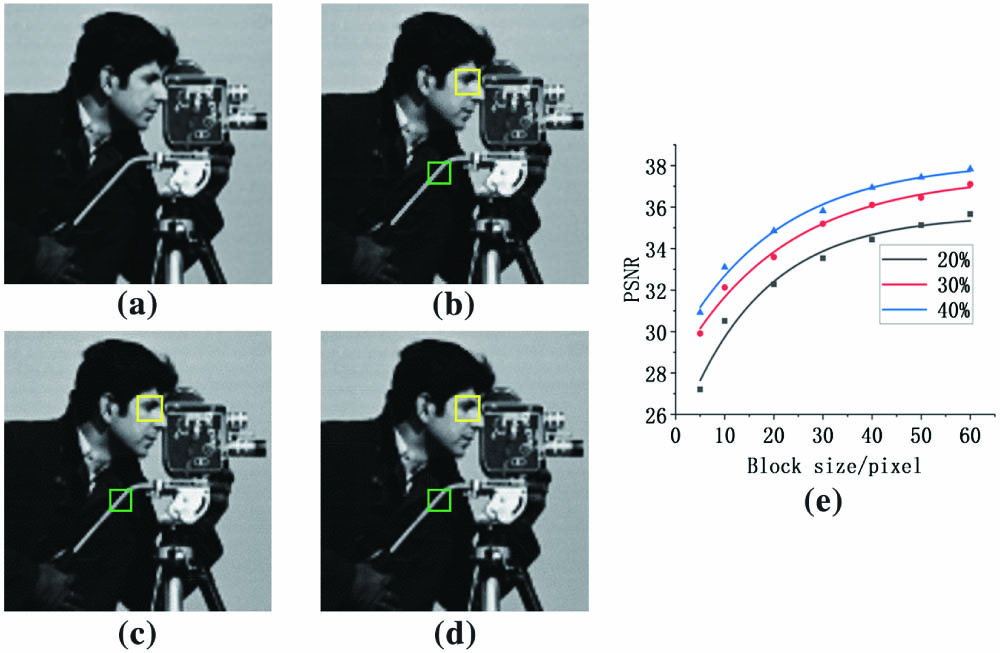
    Fig. 2. Simulation results for the effect of block size on the restored images by SAXGI. (a) Target image. (b), (c), (d) Restored images at square block sizes of 20, 40, and 60, respectively, using a sampling rate of 30%. (e) Peak signal-to-noise ratio (PSNR) of the restored images versus block size at different sampling rates.
    Numerical simulation on the megapixel SAXGI. (a) Target image. (b) Signals in the object arm with binning of 64 × 64. (c) Image reconstructed by TXGI with 1000 measurements. (d) Image reconstructed by SAXGI with 1000 measurements. (e) Line profiles of the images marked at the red lines of (a) and (d). (f) Line profiles of the images marked at the yellow lines of (a) and (d).
    Fig. 3. Numerical simulation on the megapixel SAXGI. (a) Target image. (b) Signals in the object arm with binning of 64 × 64. (c) Image reconstructed by TXGI with 1000 measurements. (d) Image reconstructed by SAXGI with 1000 measurements. (e) Line profiles of the images marked at the red lines of (a) and (d). (f) Line profiles of the images marked at the yellow lines of (a) and (d).
    Speckle pattern and corresponding autocorrelation function in the experiment. (a) Speckle pattern taken by the detector DR with the pixel size of 3.25 µm. (b) Autocorrelation function over the whole speckle pattern, which has the maximum value of 1.26 and full width at half-maximum (FWHM) of 72 µm.
    Fig. 4. Speckle pattern and corresponding autocorrelation function in the experiment. (a) Speckle pattern taken by the detector DR with the pixel size of 3.25 µm. (b) Autocorrelation function over the whole speckle pattern, which has the maximum value of 1.26 and full width at half-maximum (FWHM) of 72 µm.
    SAXGI experiments for tungsten fiber. (a) Target image taken by DR, where the edge of the cross is smooth in the inset. (b) Signals in object arm with a binning of 40 × 40. (c) Image reconstructed by TXGI with 660 measurements. (d) Image reconstructed by SAXGI with the same measurements, where the edge of the cross is uneven in the inset.
    Fig. 5. SAXGI experiments for tungsten fiber. (a) Target image taken by DR, where the edge of the cross is smooth in the inset. (b) Signals in object arm with a binning of 40 × 40. (c) Image reconstructed by TXGI with 660 measurements. (d) Image reconstructed by SAXGI with the same measurements, where the edge of the cross is uneven in the inset.
    Comparison between the line profiles of different positions in the target image and the reconstructed image. (a) Line profiles of the sparse tungsten fiber marked with red lines in Figs. 5(a) and 5(d), respectively. (b) Line profiles of the stacked tungsten fiber marked with green lines in Figs. 5(a) and 5(d), respectively.
    Fig. 6. Comparison between the line profiles of different positions in the target image and the reconstructed image. (a) Line profiles of the sparse tungsten fiber marked with red lines in Figs. 5(a) and 5(d), respectively. (b) Line profiles of the stacked tungsten fiber marked with green lines in Figs. 5(a) and 5(d), respectively.
    Haipeng Zhang, Ke Li, Feixiang Wang, Hong Yu, Changzhe Zhao, Guohao Du, Zhongliang Li, Biao Deng, Honglan Xie, Shensheng Han, Tiqiao Xiao. Megapixel X-ray ghost imaging with a binned detector in the object arm[J]. Chinese Optics Letters, 2022, 20(3): 033401
    Download Citation