
Yue Dong, Linsen Shu, Ran Lin. Microstructure and Friction and Wear Properties of Laser Cladded Fe-Cr-Mo-Si Alloy Coating[J]. Laser & Optoelectronics Progress, 2021, 58(19): 1914007
- Laser & Optoelectronics Progress
- Vol. 58, Issue 19, 1914007 (2021)
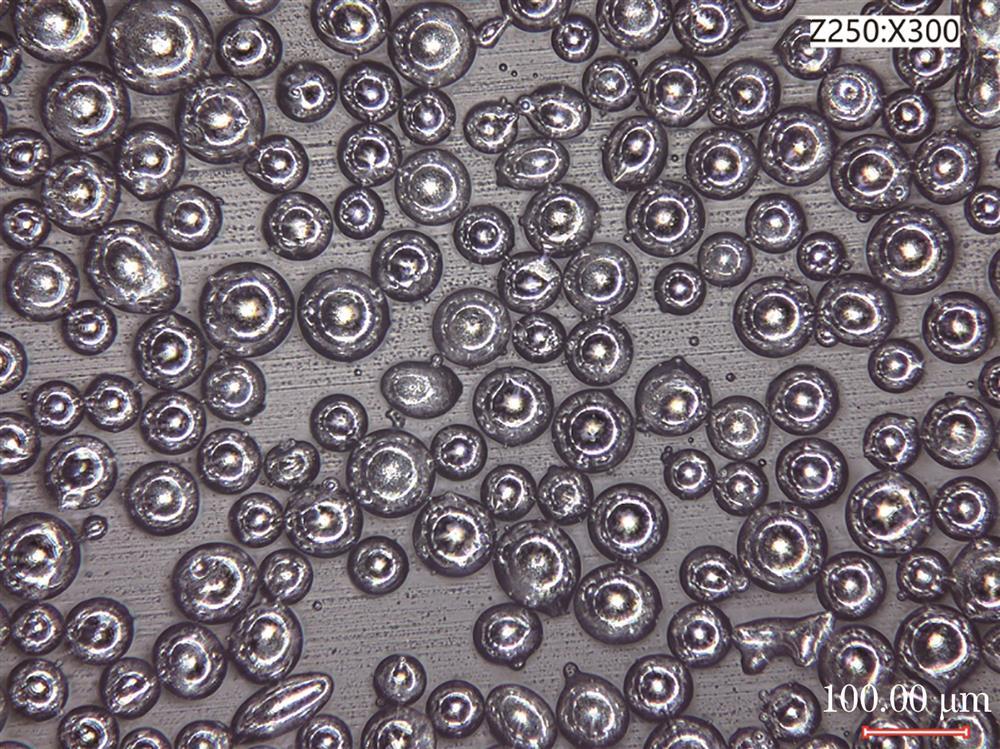
Fig. 1. Micro-morphology of Fe-Cr-Mo-Si alloy powder
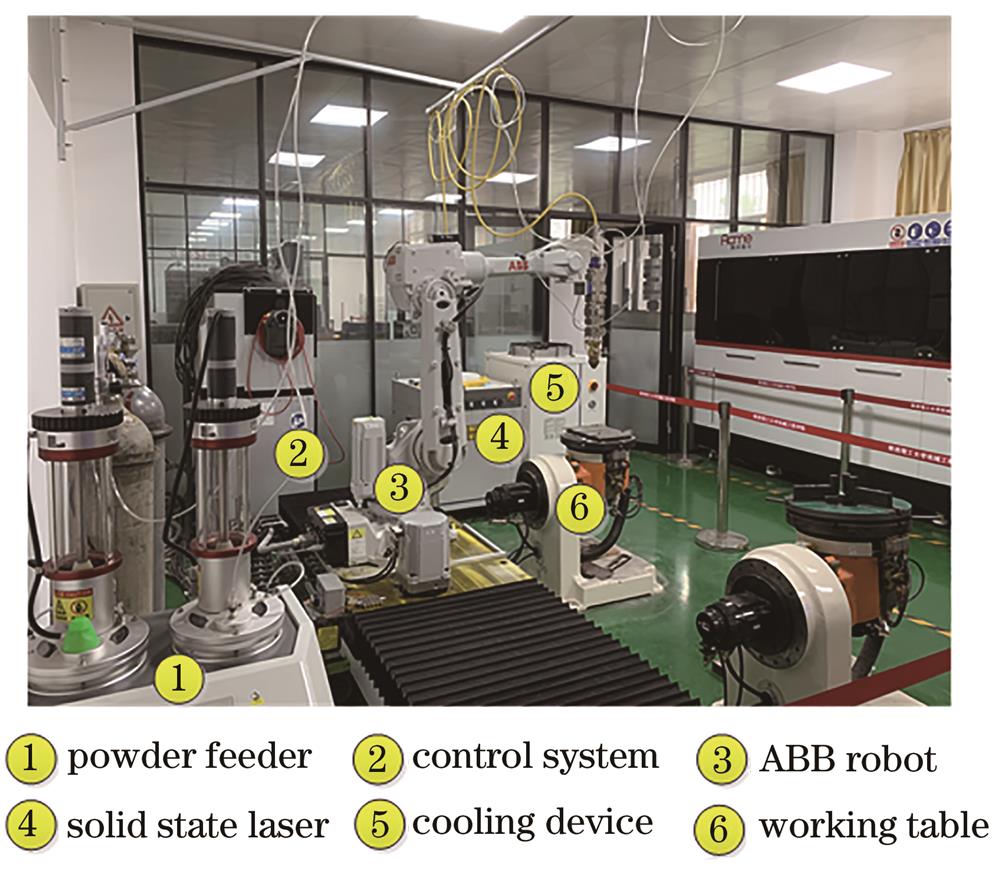
Fig. 2. Laser cladding system
Fig. 3. Test scheme of pin-disc friction-wear
Fig. 4. Morphologies of single cladding layer. (a) Macro-morphology of longitudinal section; (b) micro-morphology of cross-section
Fig. 5. Microstructures in various regions of the cross-section of laser cladding layer. (a) Top region of the cladding layer; (b) middle region of the cladding layer; (c) bottom region of the cladding layer; (d) middle region of the heat affected zone;(e)bottom region of the heat affected zone;(f)Q235 steel substrate
Fig. 6. Micro-hardness measurement on cross-section of the cladding layer. (a) Test points arrangement; (b) micro-hardness distribution curve
Fig. 7. Friction coefficient of specimens
Fig. 8. Wear outline of specimens
Fig. 9. Wear mass loss of different samples
Fig. 10. Wear surfaces of different samples. (a) Cladded sample (1#, F=50 N); (b) cladded sample (2#, F=100 N); (c) cladded sample (3#, F=150 N); (d) substrate sample (4#, F=50 N)
Fig. 11. Schematics of wear mechanism. (a) Abrasive wear; (b) adhesive wear
| |||||||||||||||||||||||||||||||||||
Table 1. Chemical composition of Fe-Cr-Mo-Si alloy powder and Q235 substrate

Set citation alerts for the article
Please enter your email address
© Copyright 2018-2021 | Chinese Laser Press. All Rights Reserved 沪ICP备15018463号-20