• Laser & Optoelectronics Progress
  • Vol. 58, Issue 14, 1410013 (2021)
Zhenzhong Zhang*
Author Affiliations
  • College of Equipment Management and Support, Engineering University of PAP, Xi’an, Shaanxi 710086, China
  • show less
    DOI: 10.3788/LOP202158.1410013 Cite this Article Set citation alerts
    Zhenzhong Zhang. Synthetic Aperture Radar Image Target Recognition Based on Updated Classifier[J]. Laser & Optoelectronics Progress, 2021, 58(14): 1410013 Copy Citation Text show less
    Structure of the CNN
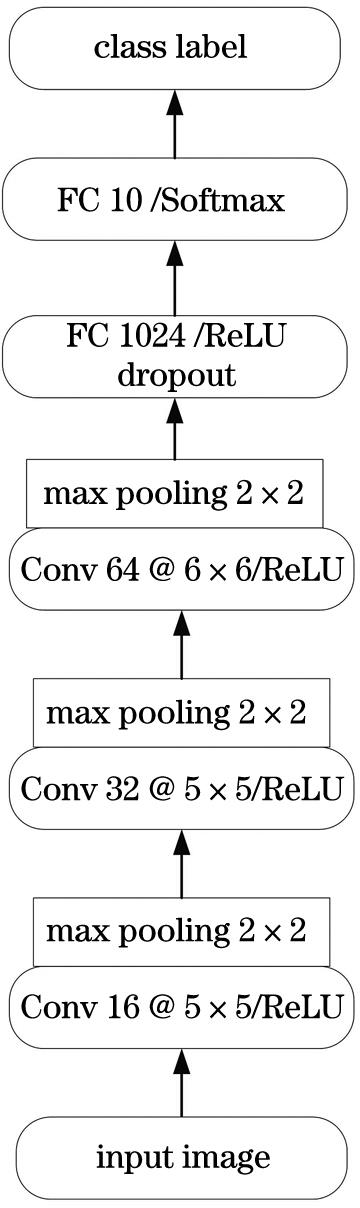
    Fig. 1. Structure of the CNN
    Flow chart of the SAR image target recognition based on updated classifier
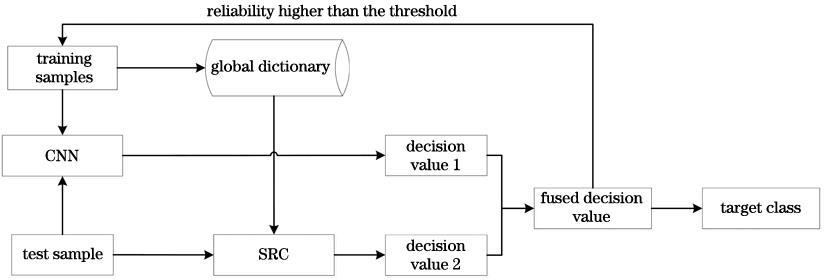
    Fig. 2. Flow chart of the SAR image target recognition based on updated classifier
    Target images in the MSTAR data set. (a) BMP2; (b) BTR70; (c) T72; (d) T62; (e) BRDM2; (f) BTR60; (g) ZSU23/4; (h) D7; (i) ZIL131; (j) 2S1
    Fig. 3. Target images in the MSTAR data set. (a) BMP2; (b) BTR70; (c) T72; (d) T62; (e) BRDM2; (f) BTR60; (g) ZSU23/4; (h) D7; (i) ZIL131; (j) 2S1
    Classification results under standard operating conditions
    Fig. 4. Classification results under standard operating conditions
    Classification results of different methods under noise interference
    Fig. 5. Classification results of different methods under noise interference
    Comparison of results under small traning samples
    Fig. 6. Comparison of results under small traning samples
    ClassTraining (17°)Test (15°)
    ConfigurationNumber of samplesConfigurationNumber of samples
    BMP2956323395639566c21195196196
    BTR70--233--196
    T72132232132812S7196195191
    T62--299--273
    BRDM2--298--274
    BTR60--256--195
    ZSU23/4--299--274
    D7--299--274
    ZIL131--299--274
    2S1--299--274
    Table 1. Test scenarios for standard operating conditions
    MethodAverage recognition rate
    Ours99.08
    SRC96.42
    A-ConvNet98.53
    Aug-CNN98.91
    SVM+SRC97.48
    Table 2. Classification results of different methods under standard operating conditions unit: %
    Threshold1.11.21.31.41.51.61.7
    Average recognition rate98.6298.8699.0299.0899.0398.7998.54
    Table 3. Classification results of our method under different decision reliability thresholds unit: %
    Class12345678910
    Decision value 10.280.050.320.040.100.040.010.060.050.05
    Decision value 20.360.070.180.060.080.070.020.050.070.04
    Fused decision value0.320.060.250.050.050.060.020.060.060.05
    Table 4. Decision variable distribution of BMP2 test sample
    Test subsetPart 1Part 2Part 3Part 4All
    Average recognition rate69.3275.4585.6489.1279.86
    Table 5. Average recognition rates of different test subsets unit: %
    ClassTrainingTest
    DepressionNumber of samplesDepressionNumber of samples
    2S117°29930°45°288303
    BDRM217°29830°45°287303
    ZSU23/417°29930°45°288303
    Table 6. Test conditions for pitch angle difference
    MethodDepression
    30°45°
    Ours96.1272.74
    SRC92.1764.38
    A-ConvNet94.1265.93
    Aug-CNN95.3869.32
    SVM+SRC94.1666.08
    Table 7. Test results under different pitch angles unit: %
    Zhenzhong Zhang. Synthetic Aperture Radar Image Target Recognition Based on Updated Classifier[J]. Laser & Optoelectronics Progress, 2021, 58(14): 1410013
    Download Citation