
Ruo-chen DAI, Huan TANG, Bin TANG, Ming-fu ZHAO, Li-yong DAI, Ya ZHAO, Zou-rong LONG, Nian-bing ZHONG. Study on Detection Method of Foxing on Paper Artifacts Based on Hyperspectral Imaging Technology[J]. Spectroscopy and Spectral Analysis, 2022, 42(5): 1567
- Spectroscopy and Spectral Analysis
- Vol. 42, Issue 5, 1567 (2022)
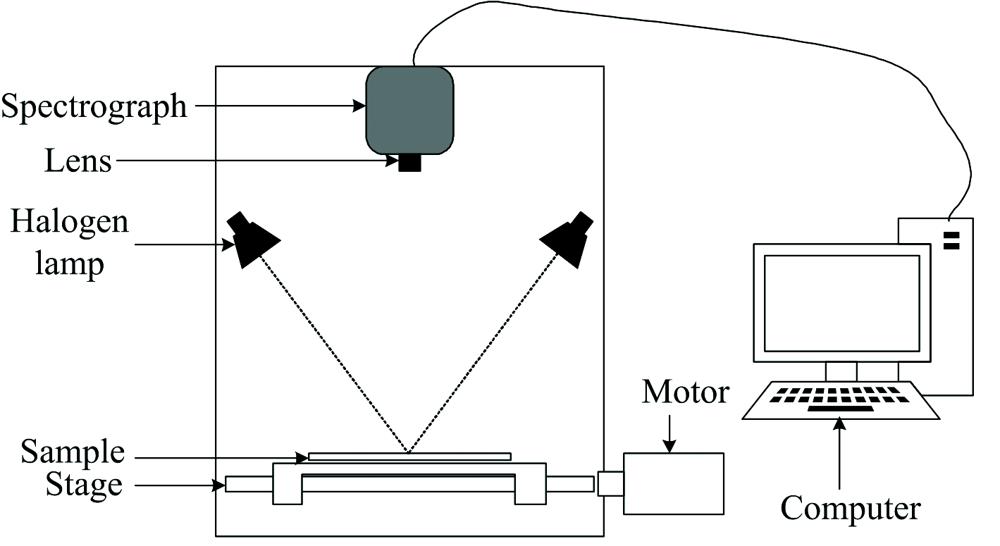
Fig. 1. Paper cultural relics foxing detection system
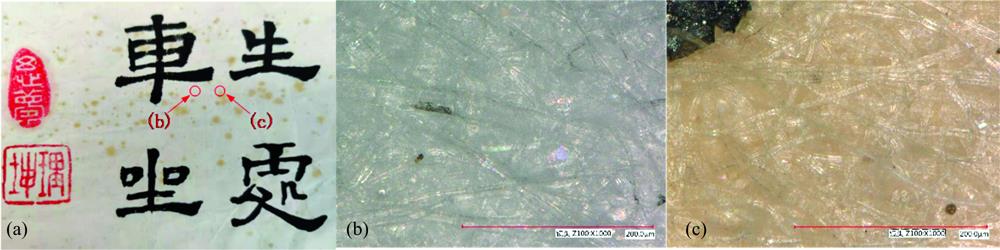
Fig. 2. (a)Part of foxing sample; (b), (c) Super depth of field micrograph
Fig. 3. Paper cultural relics reflection spectrum and average reflection spectrum
Fig. 4. Paper cultural relics feature band image
(a): 464 nm band image; (b): 787 nm band image
(a): 464 nm band image; (b): 787 nm band image
Fig. 5. Calculation results of band math of paper cultural relics
(a): 464~767 nm image; (b): 464/767 nm image; (c): 767~464 nm image; (d): 767~464 nm image
(a): 464~767 nm image; (b): 464/767 nm image; (c): 767~464 nm image; (d): 767~464 nm image
Fig. 6. The images of the simulating sample after MNF transformation
(a): MNF-band 1; (b): MNF-band 2; (c): MNF-band 7; (d): RGB image after MNF transformation
(a): MNF-band 1; (b): MNF-band 2; (c): MNF-band 7; (d): RGB image after MNF transformation
| |||||||||||||||||||||||||||||
Table 1. Results of the KNN and BP models for different parts of simulating sample

Set citation alerts for the article
Please enter your email address
© Copyright 2018-2021 | Chinese Laser Press. All Rights Reserved 沪ICP备15018463号-20