


Wei CHEN, Hai-long WU, Tong WANG, Yue-yue CHANG, Yao CHEN, Jian YANG, Hai-yan FU, Xiao-long YANG, Xu-fu LI, Ru-qin YU. Origin Traceability of Atractylodes Macrocephala Koidz. by Using Three-Way Fluorescence Coupled With Chemometrics[J]. Spectroscopy and Spectral Analysis, 2022, 42(9): 2875
- Spectroscopy and Spectral Analysis
- Vol. 42, Issue 9, 2875 (2022)
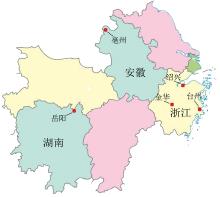
Fig. 1. Sampling points of AM in this work
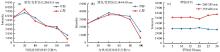
Fig. 2. (a) The relationship between fluorescence intensity of excitation/emission wavelength of 280/355 nm and extractant type and extractant ratio; (b) The relationship between fluorescence intensity of excitation/emission wavelength of 355/430 nm and extractant type and extractant ratio; (c) Variation of fluorescence intensity with ultrasonic time
Fig. 3. Rayleigh scattering eliminated from EEM data by interpolation
(a): Raw data with visible Rayleigh scattering; (b): Defect data after deducting Rayleigh scattering; (c): Data repaired by interpolation
(a): Raw data with visible Rayleigh scattering; (b): Defect data after deducting Rayleigh scattering; (c): Data repaired by interpolation
Fig. 4. Typical EEM contour map of AM samples in different provinces after deducting scattering
(a): Anhui AM; (b): Hunan AM; (c): Zhejiang AM
(a): Anhui AM; (b): Hunan AM; (c): Zhejiang AM
Fig. 5. The normalized excitation spectra profiles (a), the normalized emission spectra profiles (b) and the relative concentration spectra profiles (c) obtained by ATLD analysis of three-way matrix with N =3
Fig. 6. The normalized excitation spectra profiles (a) and normalized emission spectra profiles (b) of 7 standard substances with fluorescence signals that may be contained in AM
Fig. 7. Three-way scatter diagram of training samples based on the scores of the first three latent variables of PLS-DA
|
Table 1. Geographical and weather conditions and the number of samples when picking AM (The prediction set samplesare not included)
| ||||||||||||||||||||||||||||||||||||||||||||||||||||||||||||||||||||||||||||||||||||||||||||||||||||||||||||||||||||||||||||||||||||||||||||||||||||||||||||||||||||||||||||||||||||||||||||||||||||||||||||||||||||||||
Table 2. Chinese and English names, molecular weights, concentrations, structural formulas, purity and production companies of 17 standard substances that may exist in AM
| ||||||||||||||||||||||||||||||||||||||||||||||||||||||||||||||||||||||||||||
Table 3. The complexity parameters (LVs/k ) of the PLS-DA and k NN classification models, the classificationaccurate rate, specificity and sensitivity obtained by cross-validation, training set, test set and prediction set
| ||||||||||||||||||||||||||||||||||||||||||||||||||||||||||||||||||||||||||||||||||||||||||||||
Table 4. Confusion matrix of training set, test set and prediction set obtained by PLS-DA and k NN classification methods in AM classification model

Set citation alerts for the article
Please enter your email address
© Copyright 2018-2021 | Chinese Laser Press. All Rights Reserved 沪ICP备15018463号-20