• Acta Photonica Sinica
  • Vol. 49, Issue 12, 191 (2020)
Liang SHAN1, Hao-ran LI1, Bo HONG1, Dao-dang WANG2, Ting-ting ZHA1, and Ming KONG2、*
Author Affiliations
  • 1Key Laboratory of Electromagnetic Wave Information Technology and Metrology of Zhejiang Province, College of Information Engineering, China Jiliang University, Hangzhou3008, China
  • 2College of Metrology & Measurement Engineering, China Jiliang University, Hangzhou310018, China
  • show less
    DOI: 10.3788/gzxb20204912.1229002 Cite this Article
    Liang SHAN, Hao-ran LI, Bo HONG, Dao-dang WANG, Ting-ting ZHA, Ming KONG. Inversion of Multimodal Particle Size Distribution Based on the Artificial Bee Colony Algorithm[J]. Acta Photonica Sinica, 2020, 49(12): 191 Copy Citation Text show less
    Single particle scattering model
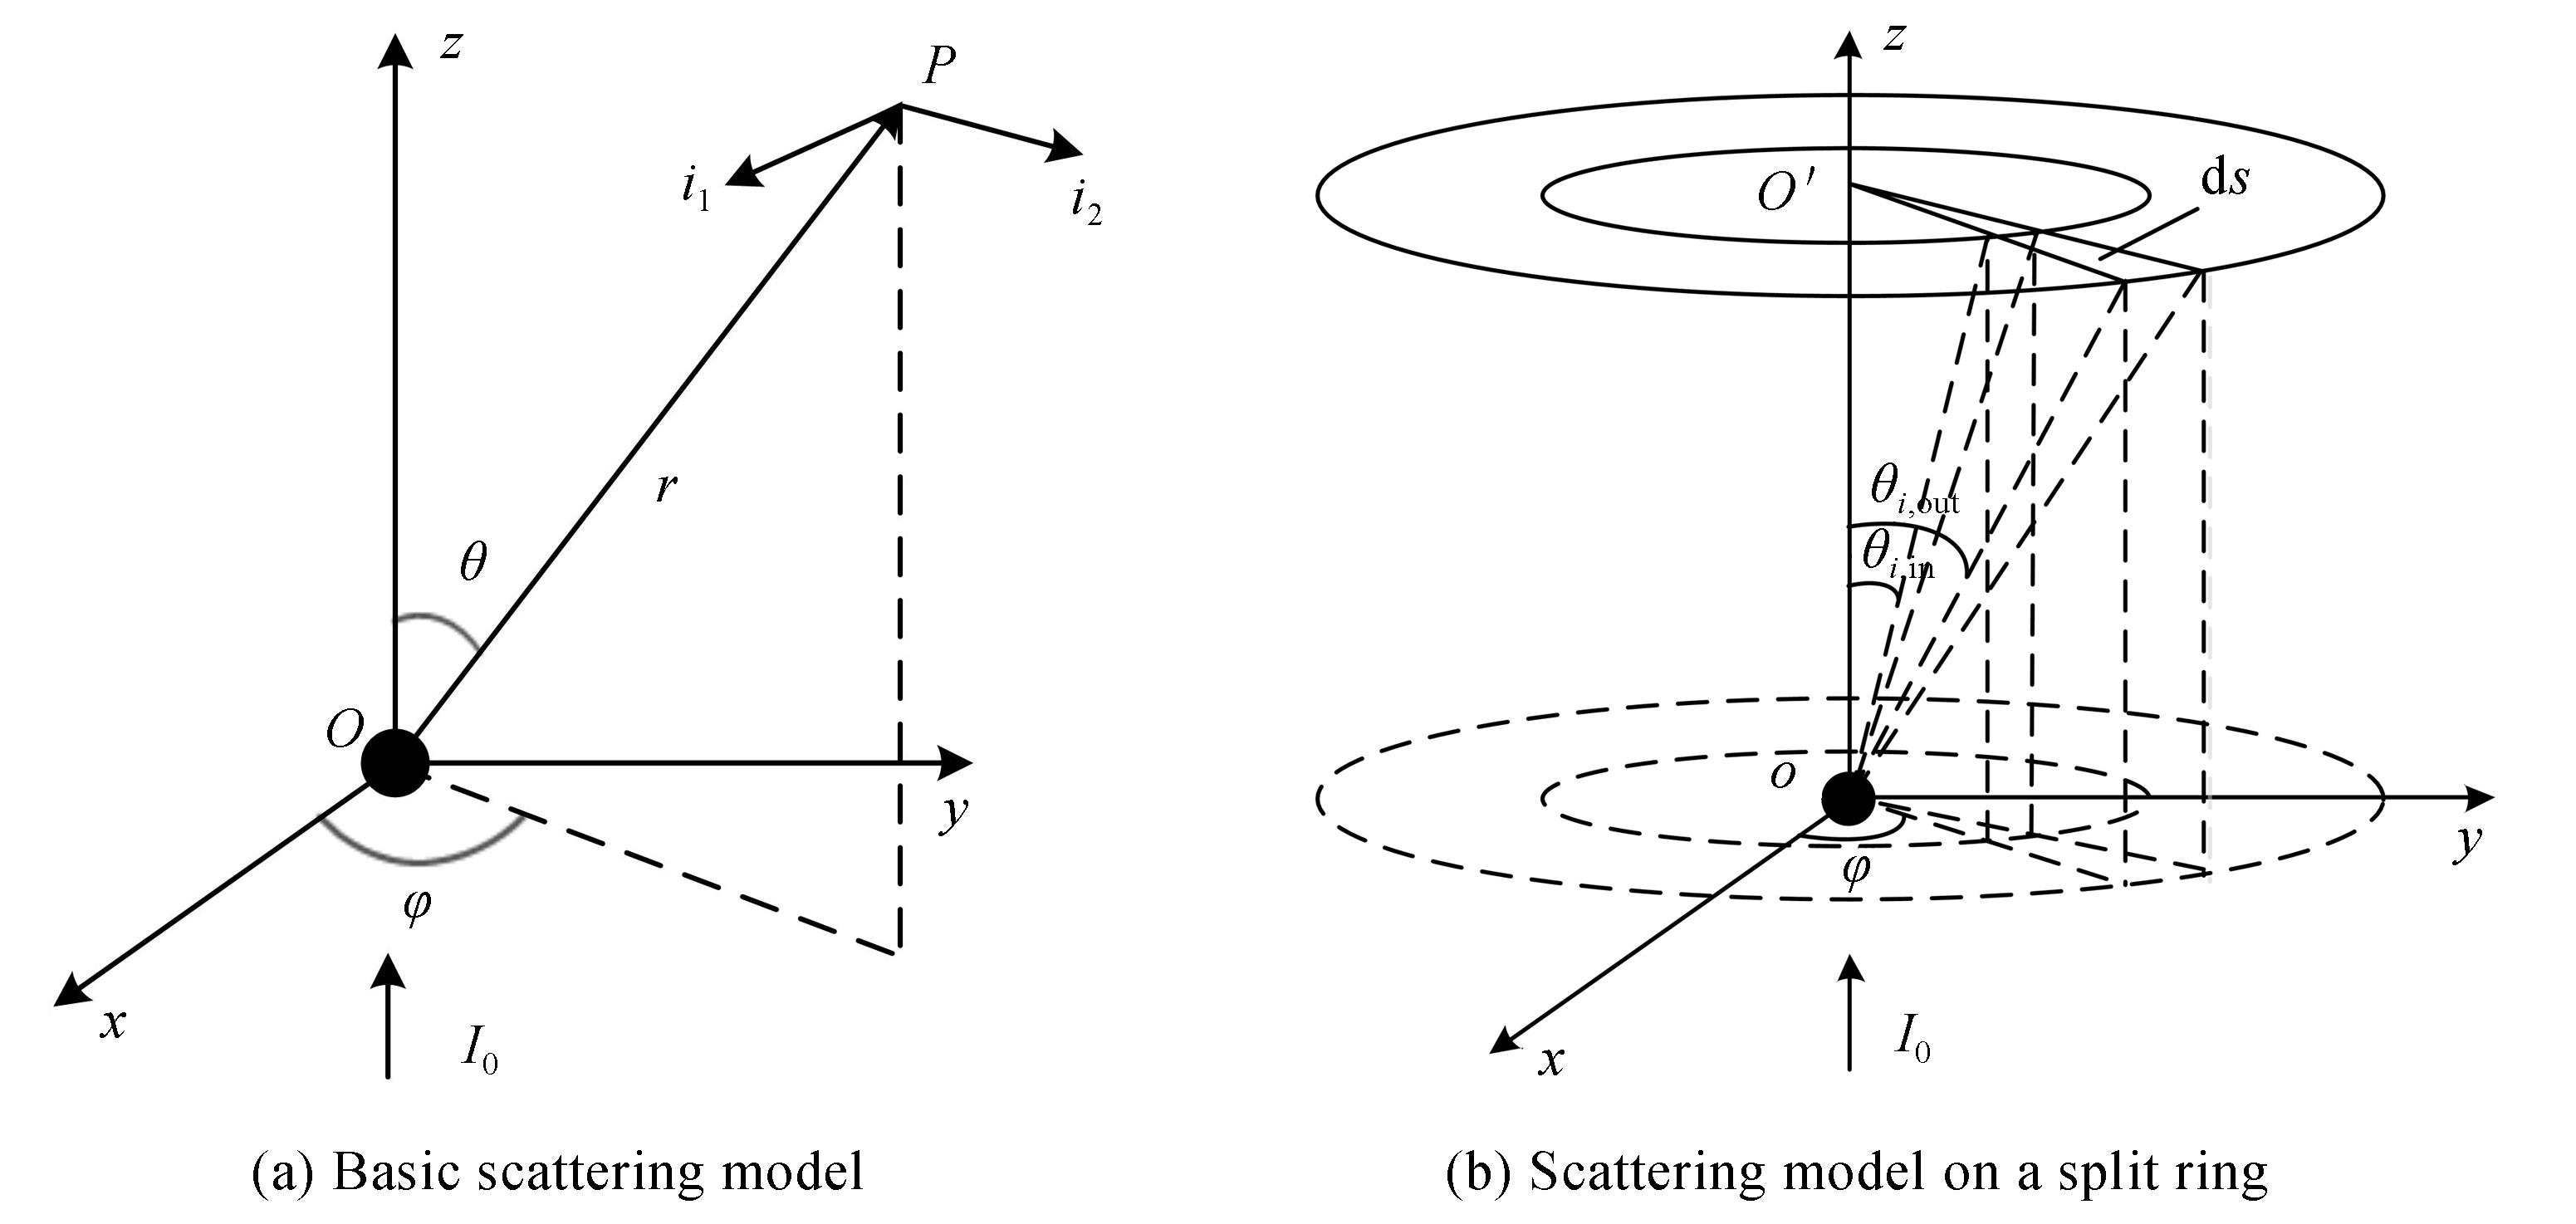
    Fig. 1. Single particle scattering model
    Flowchart of ABC algorithm
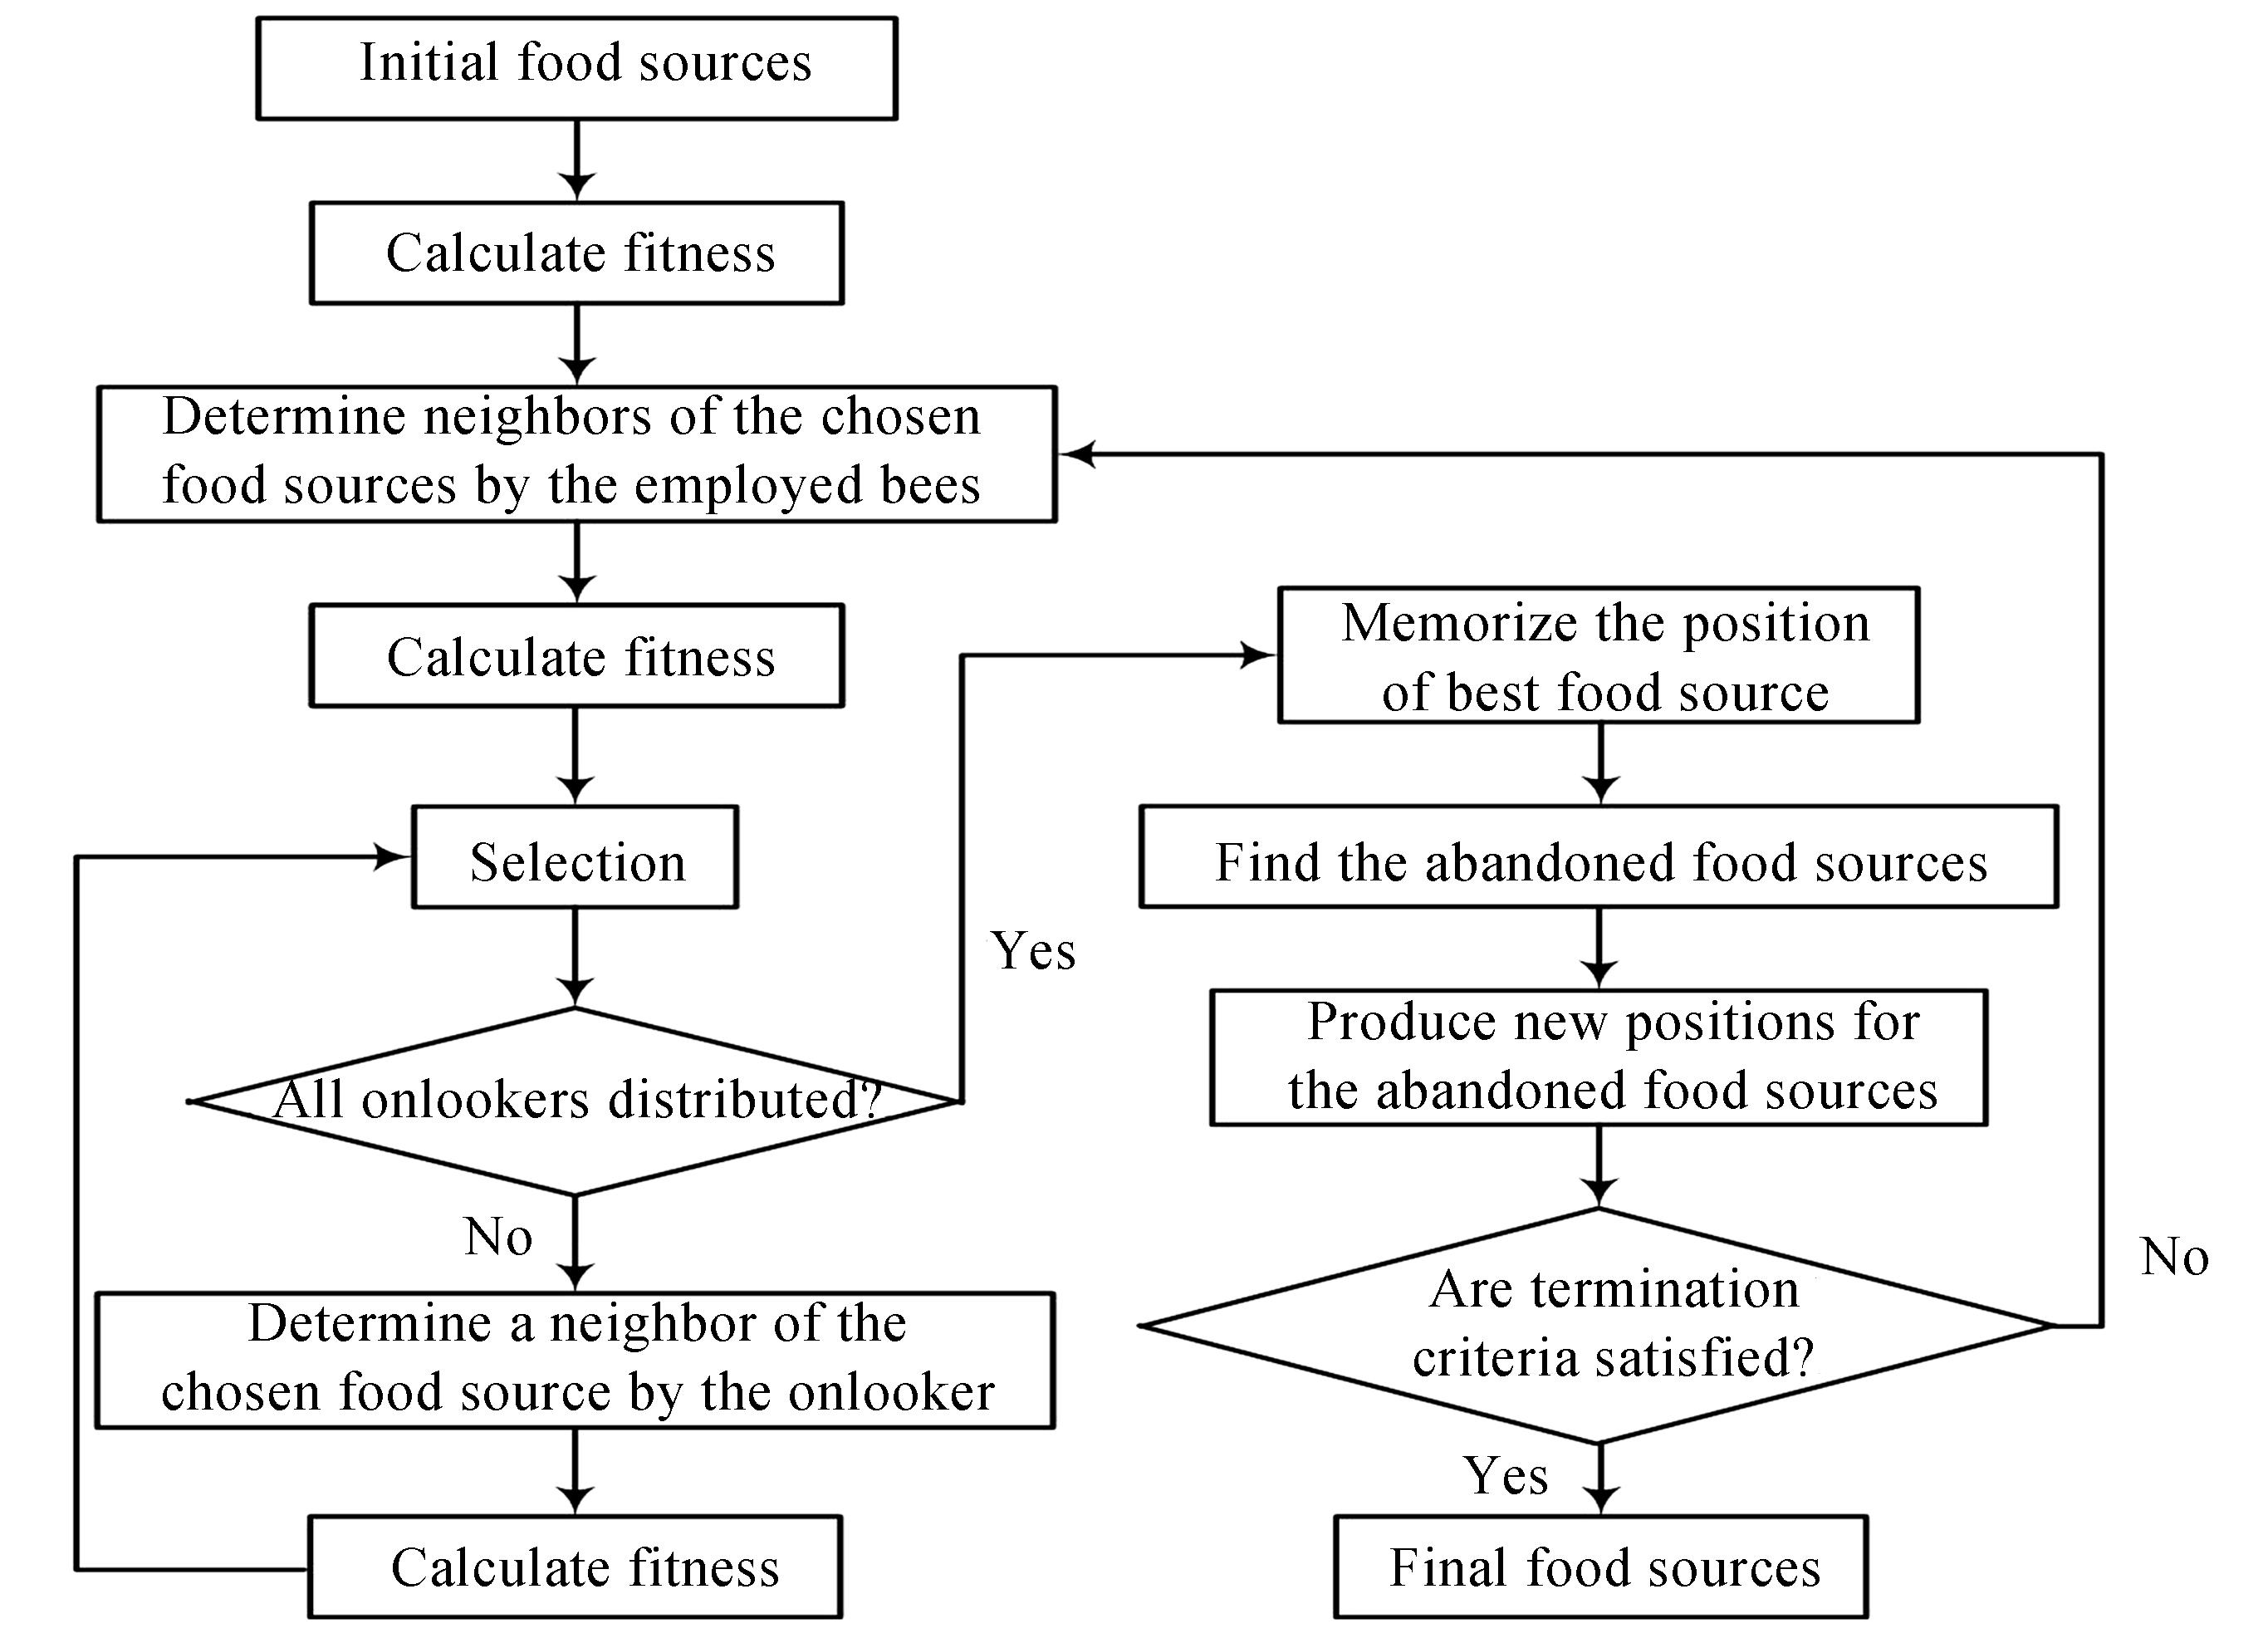
    Fig. 2. Flowchart of ABC algorithm
    Fitness value variation diagram
    Fig. 3. Fitness value variation diagram
    The inversion results of unimodal distribution
    Fig. 4. The inversion results of unimodal distribution
    The inversion results of bimodal distribution
    Fig. 5. The inversion results of bimodal distribution
    The inversion results of trimodal distribution
    Fig. 6. The inversion results of trimodal distribution
    Experimental platform
    Fig. 7. Experimental platform
    Experimental image of unimodal particle system
    Fig. 8. Experimental image of unimodal particle system
    Experimental image of bimodal particle system
    Fig. 9. Experimental image of bimodal particle system
    Distribution of light energy values
    Fig. 10. Distribution of light energy values
    Distribution function

    Mean value

    (σ, M)

    Standard deviation

    (σ, M)

    RRMSE/%
    Normal distribution10.00, 45.006.63×10-6, 6.28×10-62.26×10-6
    RR distribution10.00, 45.009.39×10-8, 6.61×10-83.53×10-8
    JSB distribution10.00, 45.000.002, 0.0010.02
    Table 1. The inversion results of unimodal distribution
    Distribution function

    Mean value

    (σ1, σ2, M1, M2)

    Standard deviation

    σ1, σ2, M1, M2)

    RRMSE/%
    Normal distribution

    6.00, 6.04

    30.00, 70.03

    0.002, 0.001

    0.001, 0.002

    0.48
    RR distribution

    5.99, 6.02

    30.01, 70.10

    0.034, 0.019

    0.025, 0.197

    0.33
    JSB distribution

    5.99, 6.16

    30.01, 70.03

    0.038, 0.312

    0.024, 0.076

    1.58
    Table 2. The inversion results of bimodal distribution
    Distribution function

    Mean value

    (σ1, σ2, σ3, M1, M2, M3)

    Standard deviation

    (σ1, σ2, σ3, M1, M2, M3)

    RRMSE/%
    Normal distribution

    4.98, 4.60, 5.43

    14.98, 49.57, 89.34

    0.08, 0.94, 3.06

    0.05, 0.70, 2.23

    8.60
    RR distribution

    5.00, 5.39, 5.61

    15.07, 51.43, 89.60

    0.08, 0.33, 3.03

    0.13, 4.62, 8.05

    5.54
    JSB distribution

    5.35, 7.81, 4.55

    15.02, 49.93, 89.63

    0.61, 4.51, 3.04

    0.06, 0.78, 4.90

    19.62
    Table 3. The inversion results of trimodal distribution
    Distribution functionRandom noiseMean valueStandard deviationRRMSE/%

    Unimodal

    (σ, M)=(10, 45 μm)

    1%9.97, 45.000.002, 0.0010.26
    3%10.14, 45.150.021, 0.0132.40
    5%9.89, 44.670.006, 0.0045.03
    10%9.05, 45.140.013, 0.0148.73

    Bimodal

    (σ1, σ2)=(6, 6),

    (M1, M2)=(30 μm, 70 μm)

    1%

    6.04, 6.26

    29.90, 70.02

    0.005, 0.023

    0.012, 0.073

    2.41
    3%

    6.10, 5.85

    29.84, 70.68

    0.008, 0.043

    0.007, 0.056

    3.34
    5%

    5.71, 4.99

    30.80, 72.11

    0.014, 0.099

    0.038, 0.341

    14.27
    10%

    6.33, 8.39

    29.53, 69.58

    0.012, 0.050,

    0.014, 0.047

    18.55

    Trimodal

    (σ1, σ2, σ3)=(5, 5, 5),(M1, M2, M3)=(15 μm, 50 μm, 90 μm)

    1%

    4.95, 5.47, 7.48

    15.12, 50.61, 93.79

    0.14, 0.45, 4.90

    0.12, 2.99, 3.14

    12.00
    3%

    4.99, 5.17, 5.88

    15.27, 54.62, 89.37

    0.11, 3.52, 4.85

    0.20, 1.77, 3.37

    14.45
    5%

    4.57, 5.30, 4.88

    15.50, 55.72, 89.68

    0.13, 1.25, 6.47

    0.17, 2.07, 11.81

    18.87
    10%

    5.58, 5.71, 6.18

    15.11, 57.02, 100.02

    0.11, 0.70, 2.39

    0.08, 2.10, 1.93

    20.14
    Table 4. The inversion results of RR distribution function with random noise
    Theoretical valueRandom noiseNNPT RRMSE/%Chahine RRMSE/%ABC RRMSE/%
    (σ, M)=(2, 30 μm)0%0.873.490.02
    5%29.8814.131.48
    (σ, M)=(4, 30 μm)0%21.821.162.27×10-8
    5%40.2714.313.65
    (σ, M)=(6, 30 μm)0%45.980.201.72×10-5
    5%52.9312.132.41
    (σ1, σ2)=(2, 2),(M1, M2)=(30 μm, 60 μm)0%3.382.701.53
    5%23.1125.5610.34
    (σ1, σ2)=(4, 4),(M1, M2)=(30 μm, 60 μm)0%20.948.060.07
    5%26.8625.175.75
    (σ1, σ2)=(6, 6),(M1, M2)=(30 μm, 60 μm)0%41.856.361.23
    5%44.9924.3618.22
    Table 5. The simulation results of ABC algorithm, NNPT algorithm and Chahine algorithm
    Theoretical value (M)Initial value rangeInversion algorithmInversion value(MRelative error (M) /%
    30 µmM∈[3~100]ABC30.97 µm3.23
    NNPT32.27 µm7.57
    Table 6. The inversion results of unimodal particle system
    Theoretical value(M1, M2Initial value rangeInversion algorithmInversion value(M1, M2Relative error (M1, M2)/%
    30 µm, 51 μmM∈[3~100]ABC31.48 μm, 51.90 μm4.93, 1.76
    NNPT32.27 μm, 53.83 μm7.57, 5.55
    Table 7. The inversion results of bimodal particle system
    Liang SHAN, Hao-ran LI, Bo HONG, Dao-dang WANG, Ting-ting ZHA, Ming KONG. Inversion of Multimodal Particle Size Distribution Based on the Artificial Bee Colony Algorithm[J]. Acta Photonica Sinica, 2020, 49(12): 191
    Download Citation